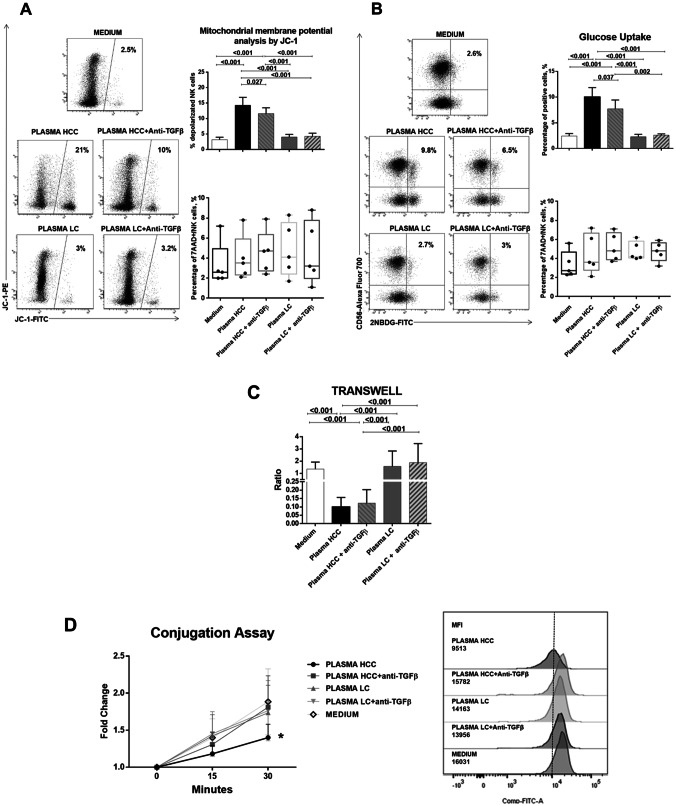
Fig. 5.
Analysis of mitochondrial membrane potential, glucose metabolism, cell migration and cell adhesion in NK-cells from healthy controls after exposure to HCC or LC plasma. PBMCs from healthy donors (n. 5) were cultured overnight in basal conditions or with addition of 30% plasma pools derived from HCC or LC patients, with or without anti-TGF-β antibody (10 µg/ml). a Mitochondrial membrane potential was measured on NK-cells by the potentiometric probe JC-1. After surface staining with anti-CD3 and anti-CD56, PBMCs were incubated with JC-1. Samples were then stained with the viability probe 7-AAD and finally acquired on flow cytometer. Depolarized NK-cells (right upper panel) were quantified by the percentage of FL1high/FL2low cells (JC-1 staining) detected in the samples in different conditions. Percentages of 7AAD positive NK-cells (right lower panel) are shown by whiskers plots. Representative dot plots (left panels) show modulation of depolarized NK-cells in different experimental conditions. b Glucose uptake assay was performed on NK-cells. PBMCs were stained with the glucose analog 2-NBDG (2-deoxy-2-[(7-nitro-2,1,3-benzoxadiazol-4-yl) amino]-d-glucose, 40 μM). Frequency of 2-NBDG-positive NK-cells was measured (right upper panel). Percentages of 7AAD positive NK-cells (right lower panel) are shown by whiskers plots. Representative dot plots (right panels) show glucose uptake in NK-cells from different experimental conditions. c 5 × 10⁵ PBMCs from each healthy control were plated in the upper chamber of a 3 µm Transwell Permeable Support, after overnight incubation in the experimental conditions. After additional 2 h, NK-cells that had migrated to the lower chamber were stained and quantified by flow cytometry. Data were expressed as migration index, obtained as ratio between the absolute number of NK-cells migrating in the lower chamber with respect to those seeded in the upper chamber. d Adhesion of NK-cells to target cells (K562) was tested by a flow cytometry-based method in different experimental conditions. The two cell types were labeled with distinct fluorescent dyes (K562 cells with 0.5 μM CFSE, NK-cells with anti-CD3 and anti-CD56). Target cells were added to NK-cells in 5:1 ratio and incubated at 37 °C for different times (0 min, 15 min and 30 min) and then fixed. Data are expressed as the ratio of MFI measured in the 15 and 30 min versus 0 min (left panel). Expression of cell conjugation is represented as MFI values of CD56 + cells in CFSE-FITC K562 fluorescence, comparing NK-cells from healthy subjects in different experimental conditions at 30 min (right panel). Graphs show mean ± SEM values. Statistical analysis was performed by the Friedman test; p values were corrected for pairwise multiple comparisons by the Dunn’s test

