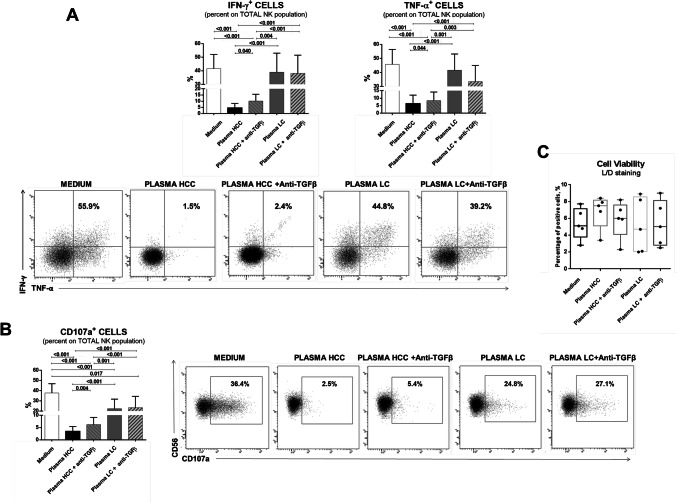
Fig. 6.
Functional analysis of NK-cells from healthy controls after exposure to HCC or LC plasma. a Upper panels: percentage of IFN-γ-positive, TNF-α-positive NK-cells obtained by PMA/Ionomycin stimulation of PBMCs from HD (n. 5) in the presence of HCC or LC plasma, with or without TGF-β blocking. Lower panels: representative dot plots illustrate cytokine production in the different experimental conditions b Upper panels: degranulation capacity (CD107a expression). Cells were stimulated with PMA and ionomycin and then incubated with anti-CD107a and monensin. Lower panels: dot plots showed representative CD107a expression in all experimental conditions. c NK-cell viability is shown by whiskers plots in the different experimental conditions. Graphs show mean ± SEM values. Statistical analysis was performed by the Friedman test; p values were corrected for pairwise multiple comparisons by the Dunn’s test

