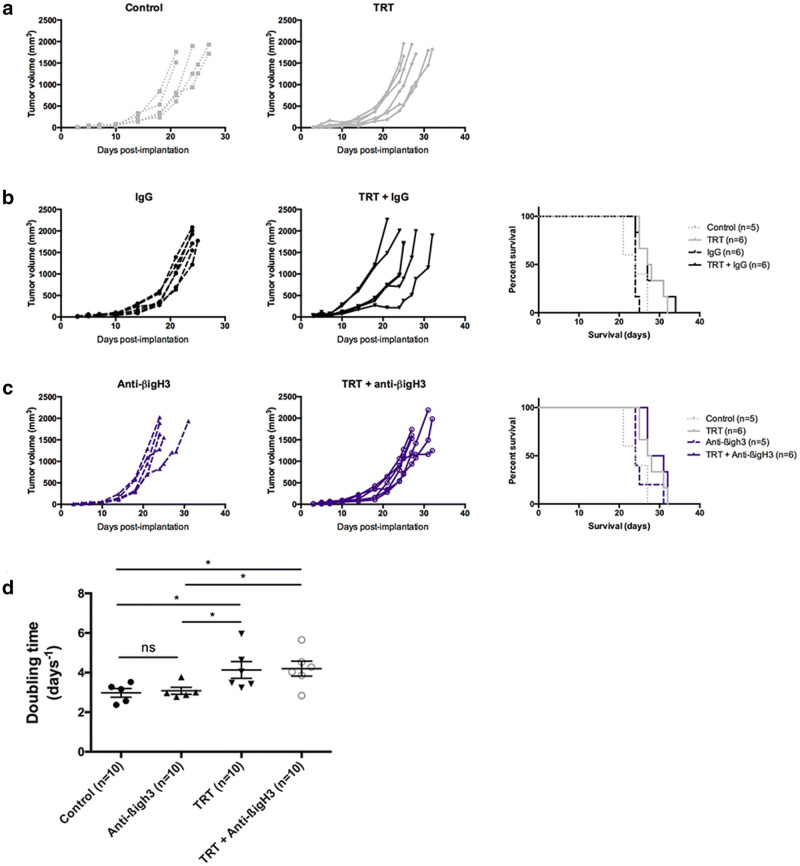
Fig. 5.
TRT combination with anti-βig-h3 antibody. Individual growth curves were represented for each pair of groups (control and TRT): (a) without immunotherapy, (b) isotype IgG, (c) anti-βig-h3. Kaplan–Meier survival curves were represented for each dual immune checkpoint inhibitor and compared with control and TRT group. (d) Doubling times for control, TRT, anti-βig-h3 alone and TRT + anti-βig-h3 groups. Median survival and doubling times are resumed in Table S2

