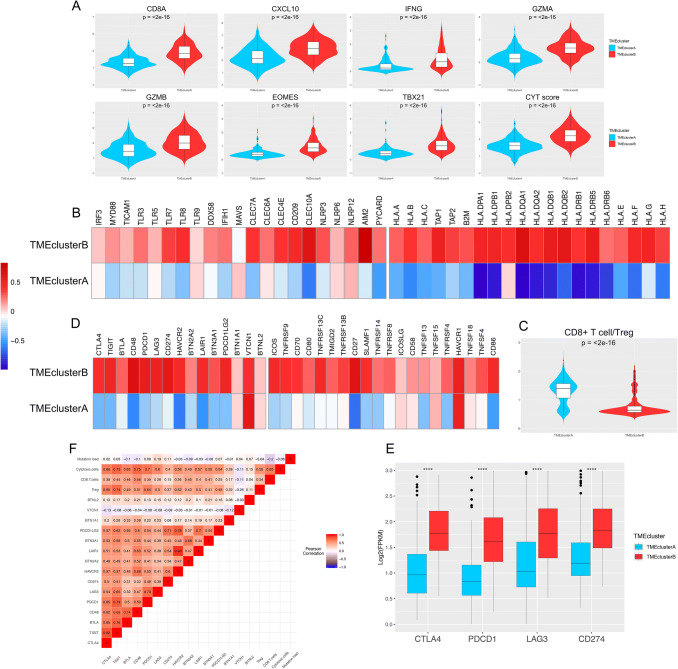
Fig. 4.
Immune microenvironment traits in the TME clusters in patients from TCGA. a Violin plots showing the expression profiling of the 7 immune-related genes in the POPLAR study and cytolytic activity (CYT) score defined by Rooney et al. The differences between every two groups were compared through the Wilcoxon test. p values indicated. b Relative expression level of molecules potentially involved in initiation of innate immunity (left) and MHC-I/II antigen-presenting process (right). c Violin plots showing the CD8+ T cells/Treg ratio in the two TME clusters. d Relative expression level of immune co-inhibitors (left) and co-stimulators (right). e The expression pattern of the four important immune checkpoint molecules in TMEcluster A and B. Within each group, the thick lines in the boxes represent the median value. The bottom and top of the boxes are the 25th and 75th percentiles (interquartile range). The whiskers encompass 1.5 times the interquartile range. The statistical difference of two TME clusters was compared through the Wilcoxon test. ****, p < 0.0001. F, Correlation between tumor immunogenicity, immune infiltration, immune checkpoint molecules, and mutation load

