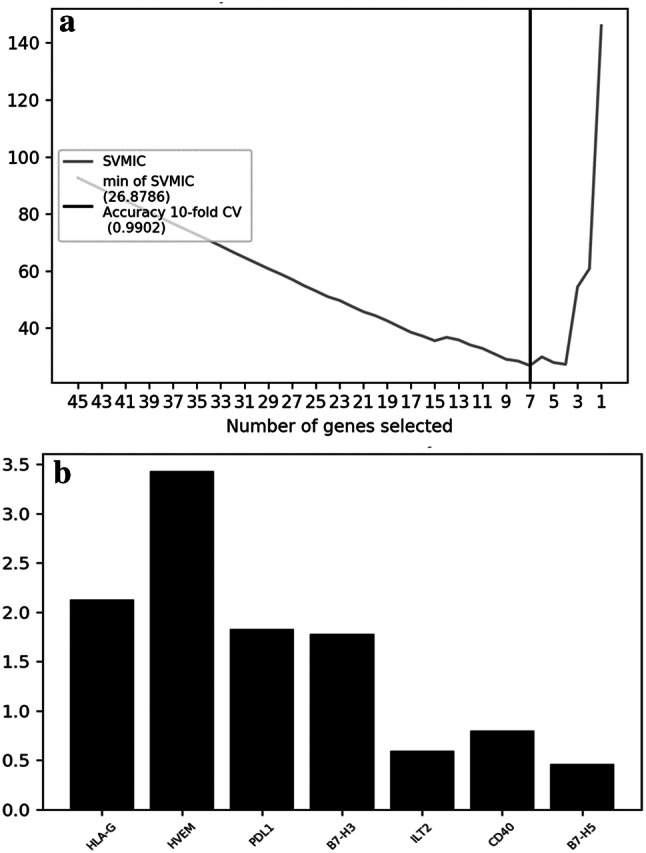
Fig. 4.

A. Plot of the SVM information criteria as a function of the subsets generated by the RFE algorithm. x-axis: number of selected genes; y-axis: cross-validations score (number of correct classifications). B. Barplot showing the importance of each of the seven features selected. The x-axis represents the selected genes and the y-axis the importance of the genes in the linear-SVM model
