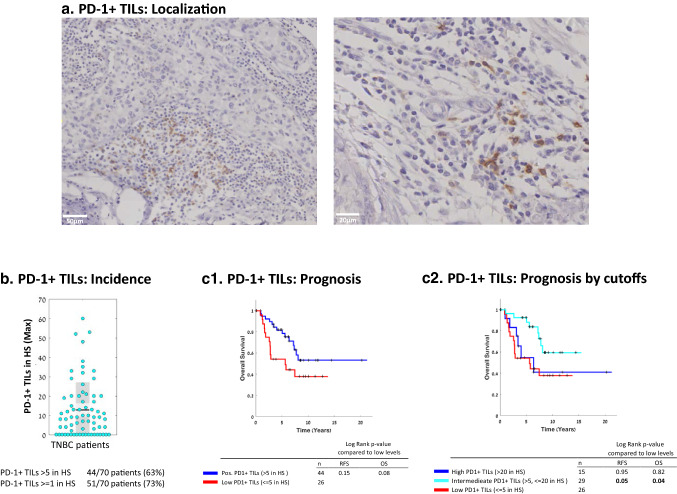
Fig. 3.
PD-1+ TILs are present in the majority of TNBC patient tumors, and are connected to patient survival in a level-dependent manner. a Representative images of PD-1+ TILs (localized at hotspots, HS) of two patient tumors, determined by IHC. b Maximal numbers of PD-1+ TILs/HS in each patient tumor (=dot). Graph parameters are as in Fig. 1. c OS Kaplan-Meier plots comparing patients with PD-1+ TILs at levels determined “Positive” (Pos; > 5/HS) vs. “Low” (≤ 5/HS) (c1), and comparing patients with PD-1+ TILs at different cutoffs (c2). The RFS Kaplan-Meier plot corresponding to Part c1 is provided in Supplementary Figure 1c. +, Censored. Inter Intermediate; HS Hotspot. p values of OS and RFS analyses are provided in the respective Figures

