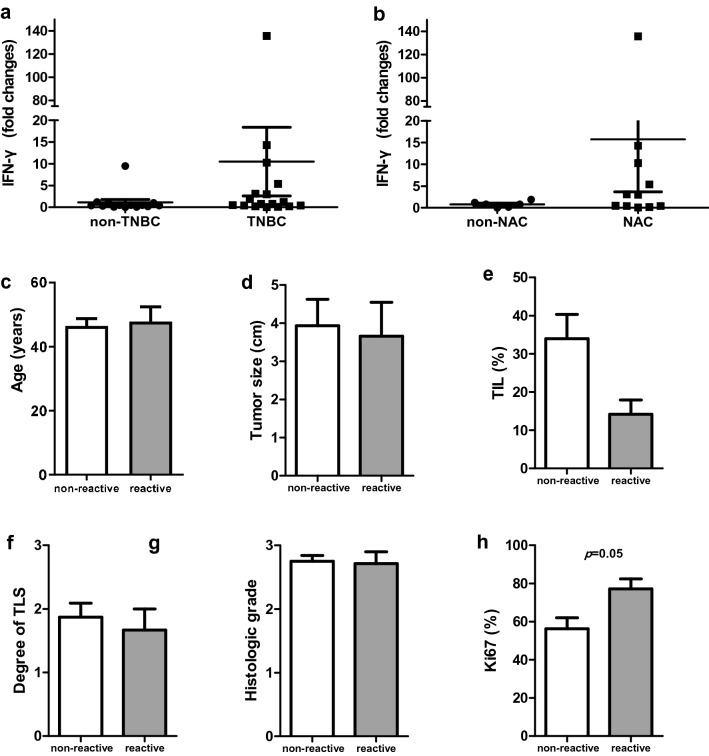
Fig. 2.
Reactivity of REP TILs against autologous cancer cells and clinicopathologic factor comparison according to reactivity. Comparison of IFN-γ production of expanded TILs after co-culture with autologous cancer cells between TNBC and non-TNBC samples (a) and between NAC and non-NAC samples (b). Comparison of age (c), tumor size (d), TIL level (e), TLS level (f), histologic grade (g), and percentages of Ki67 (h) between non-reactive (white bar) and reactive (grey bar) groups

