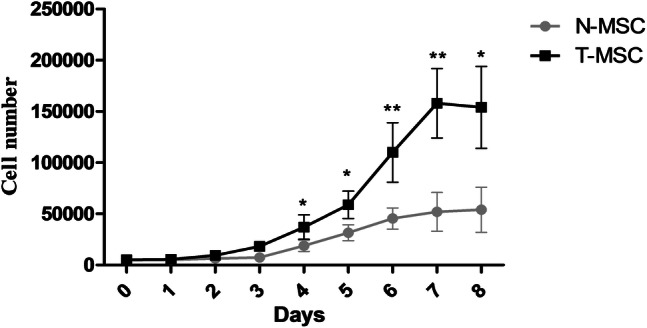
Fig. 3.

Growth curves of mesenchymal stem cells (MSCs) from breast tumor tissues (T-MSC) and normal breast adipose tissues (N-MSC). The growth curves were used to compare the cell growth characteristics between T-MSCs and N-MSCs. Data presented as mean ± SEM of three independent experiments. *P < 0.05, **P < 0.01
