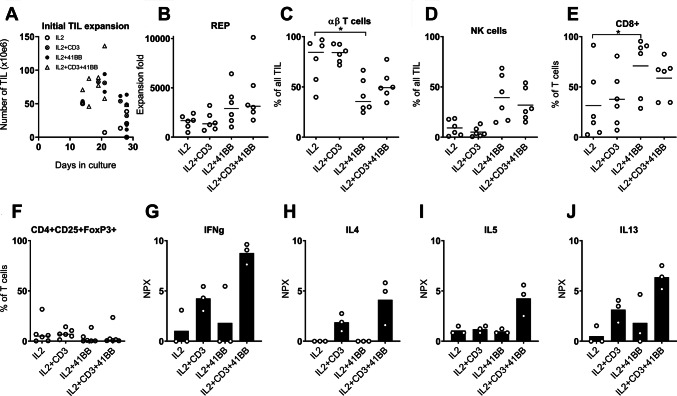
Fig. 3.
Eight samples were stimulated with 4-1BB and/or CD3 antibodies during expansion to test the effect of these on expansion time and phenotypic characteristics. Significant variation (Friedman; p < 0.05) from the control group with only IL2 stimulation are shown with a *. a Scatter plot showing the total yield and expansion time of Young TILs for the four analyte groups. b Dot plot showing expansion fold from the REP for the four analyte groups. Only the six samples with TIL from all analyte groups are shown (for SAR-30, we used TIL grown from 48 fragments for the IL2 group). c Dot plot showing percentage of αβ T cells in the Young TIL populations for the four analyte groups. As above, only six samples are shown. d Dot plot showing percentage of NK cells in the Young TIL populations for the four analyte groups. As above, only six samples are shown. e Dot plot showing expression of CD8+ on T cells in the Young TIL population. f Dot plot showing percentage of regulatory T cells in the REP TIL population. g–j Bar plots showing median NPX values as measures of IFNγ, IL4, IL5, and IL-13 concentrations in the supernatants on day 5 of expansion. Each open circle represents one patient sample

