Fig. 4.
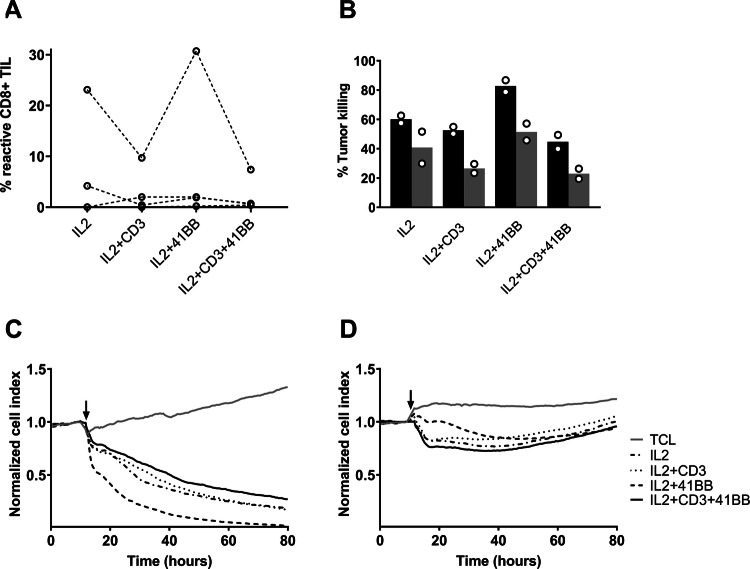
TILs expanded with 4-1BB and/or anti-CD3stimulation were tested for reactivity using flow cytometry and compared with TILs expanded with only IL-2 stimulation. Subsequently, TIL cytolysis of tumor cells was assessed using xCelligence. a Scatter plot showing percentage of tumor-reactive CD8+ T cells in the REP TIL population. Each open circle represents one patient sample. Samples from the same patient are connected with a line. b Bar plot of cytolysis of SAR-26 tumor cells following co-culture with TIL measured by Xcelligence. Bars show the percentage killing of tumor cells after 24 h of co-culture with TIL (black bars) and percentage killing after 24 h of co-culture with TIL and the HLA class I blocking agent W6/32 (gray bars). The assay was performed in duplicates each indicated by an open circle. c Graph showing an example of cytolysis from a TIL sample with high reactivity (SAR-26) as a function of time using xCelligence. The arrow indicates the time point for addition of the REP TILs. d Graph showing an example of minimal/lacking cytolysis from a TIL sample with low reactivity (SAR-28) as a function of time using xCelligence. The arrow indicates the time point for addition of the REP TILs

