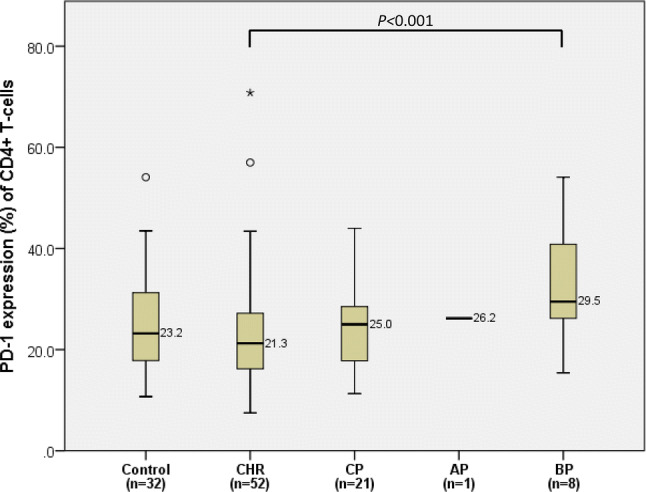
Fig. 7.

Comparison of PD-1 expression on CD4+ T-cells between BM controls and CML patients in complete hematologic response (CHR), in chronic phase (CP), in accelerated phase (AP), and blast phase (BP). In each box plot, the median value is reported besides the box. The upper, lower ends, and inner lines of the boxes correspond to the 3rd quartile, 1st quartile, and median values, respectively. Error bars denote minimum and maximum values, and circles and stars indicate outlier values. One patient in AP was excluded from the statistical analysis and only denoted in the figure
