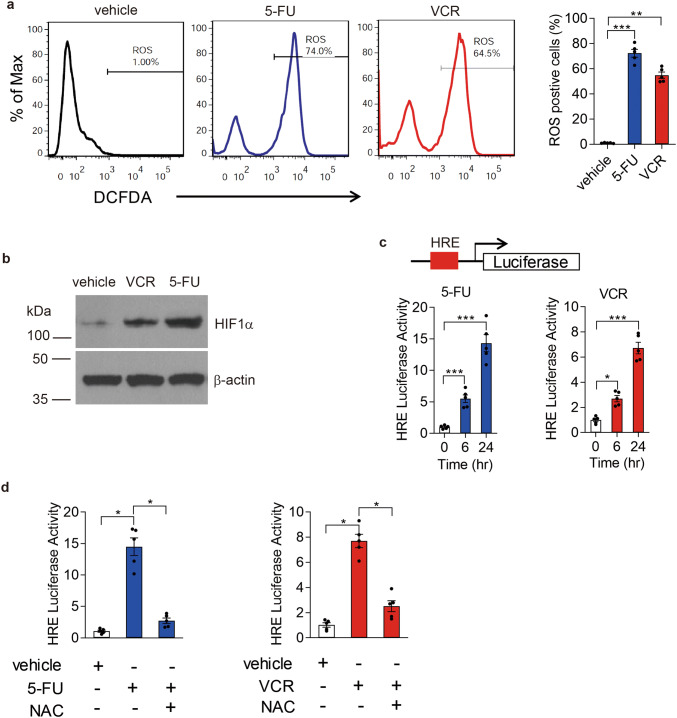
Fig. 1.
Chemo-agents activate HIF1α signaling via inducing ROS accumulation in gastric cancer cells. a Representative images of flow cytometry analysis of intracellular ROS. AGS cells were treated by 0.1 mg/ml 5-FU or 0.1 nmol/l VCR for 24 h and then stained with DCFDA for the ROS analysis by flow cytometry. ROS-positive cells were quantified. n = 5 for each group. b Representative images of immunoblotting of HIF1α and β-actin (internal control) in the cell extracts of AGS cells 24 h after treatments by VCR or 5-FU. c Luciferase activities were determined in AGS cells treated by 5-FU or VCR for indicated time. d Luciferase activities were determined in AGS cells treated with vehicle, 5-FU, 5-FU combined with NAC, VCR, or VCR combined with NAC, respectively. For c, d AGS cells were transfected with reporter constructs within which luciferase expression is driven by the activated HRE element. The expression of luciferase is driven by the HRE element. Luciferase activity is presented as fold change after normalizing values of Luc to Renilla (RLU). The values of vehicle control group were set as “1”. All data are shown as mean ± SEM. *p < 0.05; **p < 0.01; or ***p < 0.001 by one-way ANOVA

