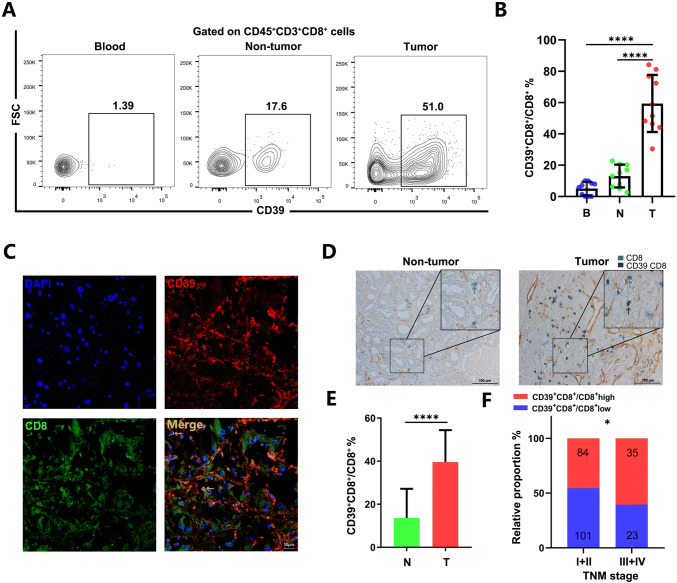
Fig. 1.
Accumulation of CD39+CD8+ T cells in renal cell carcinoma associated with disease progression. a, b The representative flow cytometry and statistics analysis of CD39 expression on CD8+ T cells in matched PBMCs, non-tumor tissues and tumor from patients with ccRCC (n = 10). ✱✱✱✱p < 0.0001 by paired t test. c Representative images of the immunofluorescence staining with CD39 (red), CD8 (green),DAPI (blue) and Merge (double positive) on ccRCC tissues. Scans were imaged at 200 magnification. d, e The percentage of CD39 expressed on CD8+ T cells is more in tumor than in non-tumor tissues. ✱✱✱✱p < 0.0001 by Student’ s t test. f The percentage of CD39+CD8+ T cells was elevated as the TNM stage progressed. ✱p < 0.05 by Chi square test. B = blood, N = non-tumor, T = tumor

