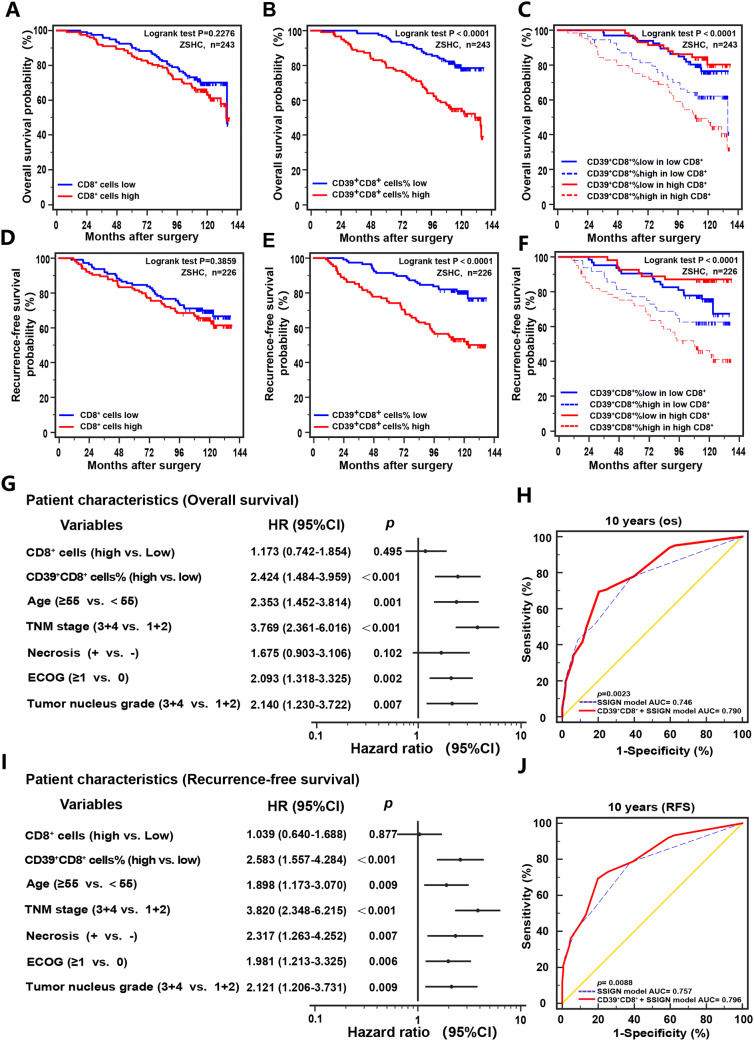
Fig. 2.
CD39+CD8+ T cells predict sunitinib therapeutic response. Kaplan–Meier curve of overall survival (OS) and recurrence-free survival (RFS) of 243 non-metastatic ccRCC patients according to the CD8+ T cells expression (a, d), and percentage of CD39+CD8+ cells (b, e) and to the combination of both markers (c, f). Log-rank tests were used to derive p values for comparisons between groups. Multivariate Cox analysis identified the independent prognostic factors for OS and RFS in ccRCC patients (g, i). ROC analysis for predictive accuracy of SSIGN alone and combined with CD39 expression level for 10-year OS (h) and RFS (j). HR, hazard radio; CI, confidence interval

