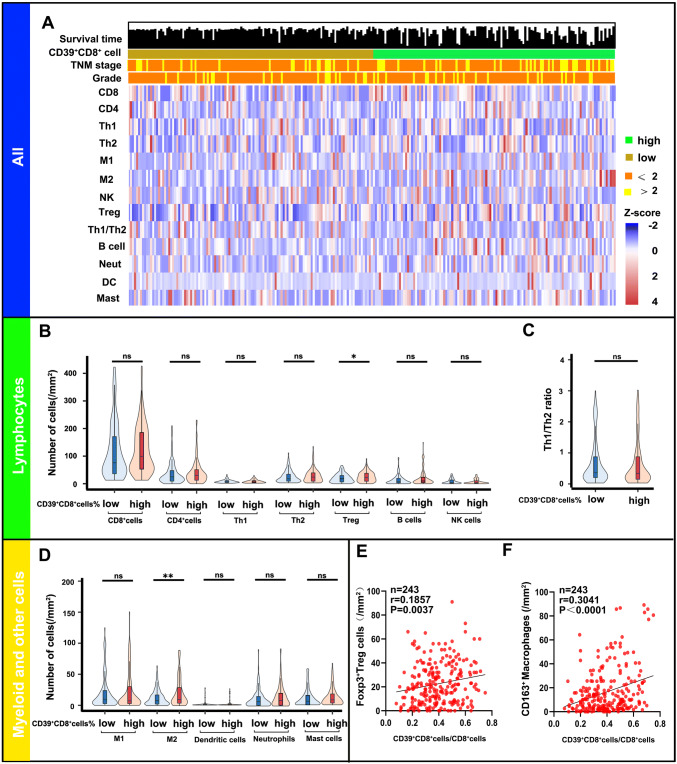
Fig. 5.
Infiltration of CD39+CD8+ T cells in the tumor microenvironment is accompanied by Tregs and M2. a Heat map displaying scaled expression of various immune cell types between high/low percentage of CD39+CD8+ T cells. b–f Comparison of the various immune cell types between high/low percentage of CD39+CD8+ T cells. ns: no significance, ✱p < 0.05 and ✱✱p < 0.01 by Mann–Whitney U test; B cell = B cells; CD4 = CD4+ T cells; Th1 = type 1 T helper cells; Th2 = type 2 T helper cells; CD8 = CD8+ T cells; DC = dendritic cells; M1 = M1 macrophages; M2 = M2 macrophages; Mast = mast cells; Neut = neutrophils; NK = nature killer cells; Treg = regulatory T cells

