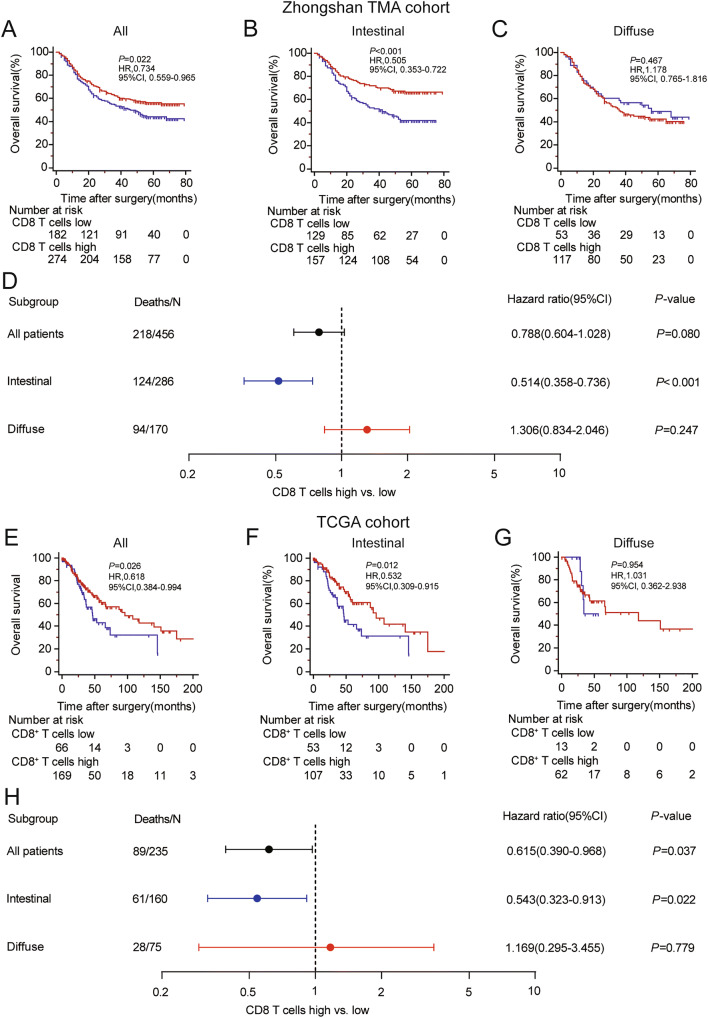
Fig. 2.
Prognostic value of CD8+ T cell infiltration for gastric cancer patients with different Lauren subtypes. a–c Kaplan–Meier curves of overall survivals stratified by CD8+ T cell infiltration for all patients (a), intestinal type patients (b) and diffuse type patients (c) in the Zhongshan TMA cohort. Blue curves, CD8+T cells low infiltration; red curves, CD8+ T cells high infiltration. d Forest plot of CD8+ T cell infiltration on survival analysis adjusted for TNM stage, age, gender and tumor grade by multivariate Cox regression model in Zhongshan TMA cohort. e–g Kaplan–Meier curves of overall survivals stratified by CD8+ T cell infiltration for all patients (e), intestinal type patients (f) and diffuse type patients (g) in the TCGA cohort. Blue curves, CD8+T cells low infiltration; red curves, CD8+ T cells high infiltration. h Forest plot for CD8+ T cell infiltration on survival analysis adjusted for TNM stage, age, gender and tumor grade by multivariate Cox regression model in the TCGA cohort. TNM tumor nodes metastasis, TMA tissue microarray, TCGA the cancer genome atlas

