Fig. 1.
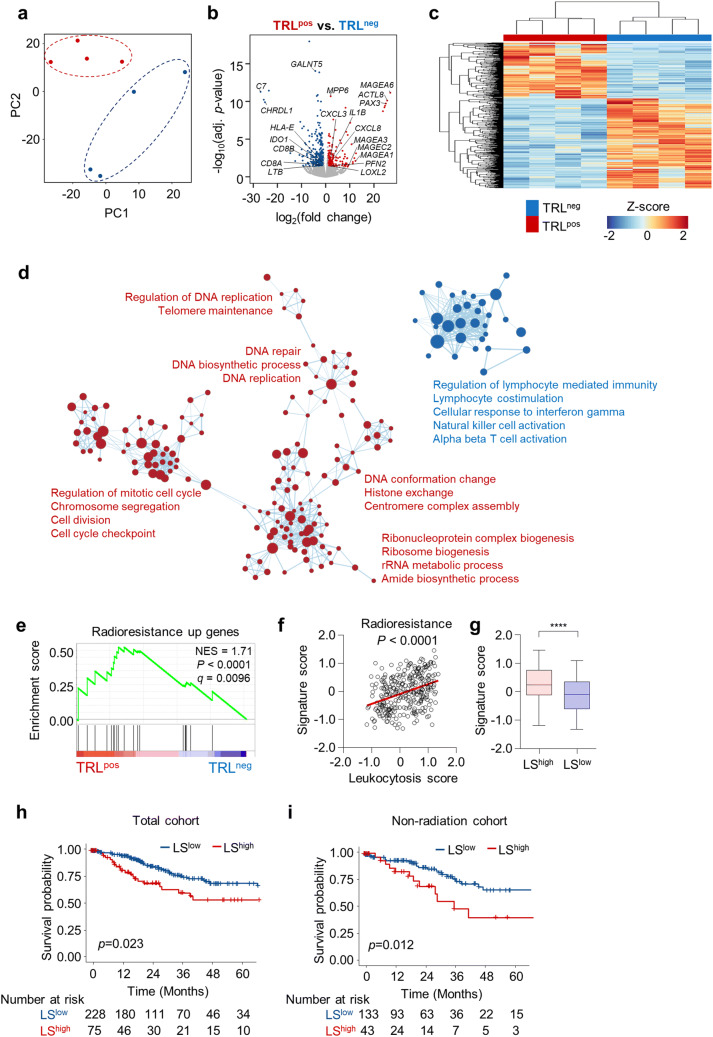
TRLpos tumors exhibit a gene expression profile distinct from that of TRLneg tumors. a Principal component analysis of tumors from patients with (TRLpos; n = 4) and without (TRLneg; n = 4) TRL. b Volcano plot demonstrating the differentially expressed genes between the TRLpos and TRLneg tumors. The blue and red dots indicate significantly down- or up-regulated genes in TRLpos tumors, respectively (log2fold change > 1, adjusted P < 0.05). c Unbiased hierarchical clustering analysis of differentially expressed genes in TRLpos and TRLneg tumors. d Expression levels of gene ontology (GO) gene sets in TRLpos and TRLneg tumors. A gene set enrichment analysis (GSEA) was used to identify positive (red) and negative (blue) enrichment of GO gene sets in TRLpos tumors. The size of the nodes represents the number of genes in each pathway, and the links represent genes that are shared by two given pathways. Networks were generated using cytoscape. e GSEA of the radioresistance gene signature in TRLpos (n = 4) and TRLneg (n = 4) tumors. f Correlation plot between the LS score and radioresistance gene signature score in the TCGA uterine cervical cancer cohort (n = 303). Signature scores were calculated using a gene set variation analysis (GSVA). g Radioresistance gene signature scores in LShigh and LSlow tumors. The lines in the boxplot indicate median values, the boxes indicate the IQR values, and the whiskers extend to 1.5 × the IQR values. h, i Overall survival of patients with LSlow tumors and those with LShigh tumors in the whole TCGA cervical cancer cohort (h; n = 303) and patients who did not receive radiotherapy (i; n = 176). Student’s t-test (g), log-rank test (h, i). ****, P < 0.0001

