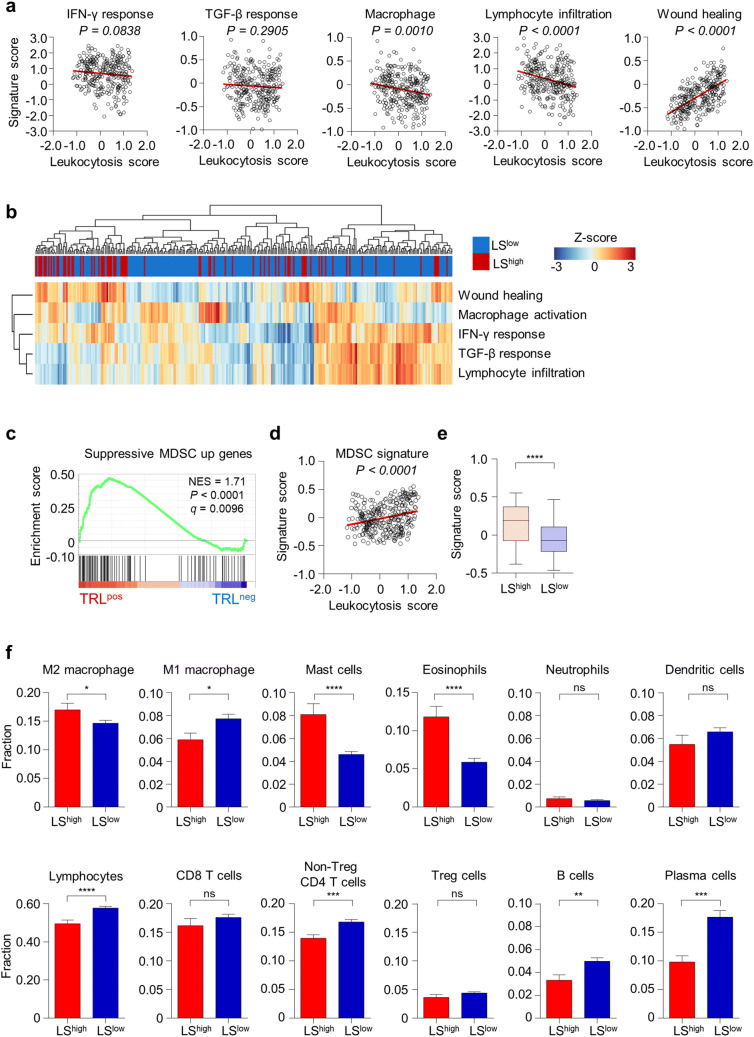
Fig. 2.
LShigh tumors have a more suppressive immune microenvironment than LSlow tumors. a Correlation between the LS score and signature scores for the IFN-γ response, the TGF-β response, macrophage, lymphocyte infiltration, and wound healing in the TCGA uterine cervical cancer cohort (n = 303). b Unbiased hierarchical clustering analysis for the signature scores for the IFN-γ response, the TGF-β response, macrophage, lymphocyte infiltration, and wound healing signatures in LShigh (n = 75) and LSlow (n = 228) tumors. c GSEA of the immunosuppressive MDSC gene signature in TRLpos (n = 4) and TRLneg (n = 4) tumors. d Correlation plot between the LS score and the immunosuppressive MDSC gene signature score (n = 303). e Immunosuppressive MDSC gene signature scores in the LShigh (n = 75) and LSlow (n = 228) tumors. The lines in the boxplot indicate median values, the boxes indicate the IQR values, and the whiskers extend to 1.5 × the IQR values. f The fraction of different immune cell subsets in the LShigh (n = 75) and LSlow (n = 228) tumors. The fractions of cells were derived from CIBERSORT. Bar graphs represent mean and s.e.m. Student’s t-test (e, f). ns, not significant; *, P < 0.05; **, P < 0.01; ***, P < 0.001; ****, P < 0.0001

