Fig. 4.

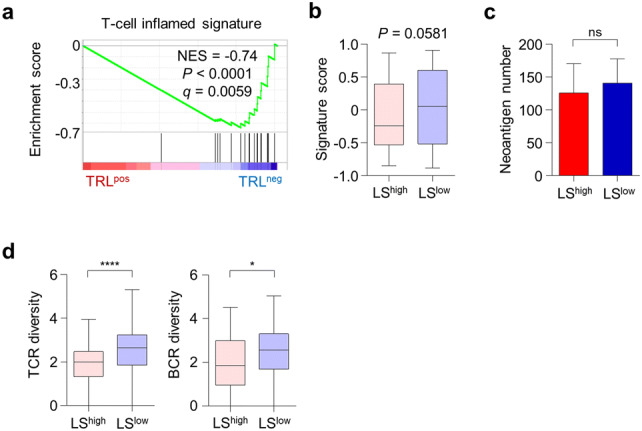
TRLpos and LShigh tumors exhibit features of anti-PD-1 unresponsiveness. a GSEA of the T-cell-inflamed gene signature in TRLpos and TRLneg tumors. b T-cell-inflamed gene signature scores in LShigh (n = 75) and LSlow (n = 228) tumors. c Neoantigen number in LShigh (n = 75) and LSlow (n = 228) tumors. d T-cell receptor (TCR) and B-cell receptor (BCR) diversity in LShigh (n = 75) and LSlow (n = 228) tumors. Diversity indicates the Shannon entropy score. The lines in the boxplot indicate the median values, the boxes indicate the IQR values, and the whiskers extend to 1.5 × the IQR values. Bar graphs represent mean and s.e.m. Student’s t-test (b-d). ns, not significant; *, P < 0.05; ****, P < 0.0001
