Fig. 5.
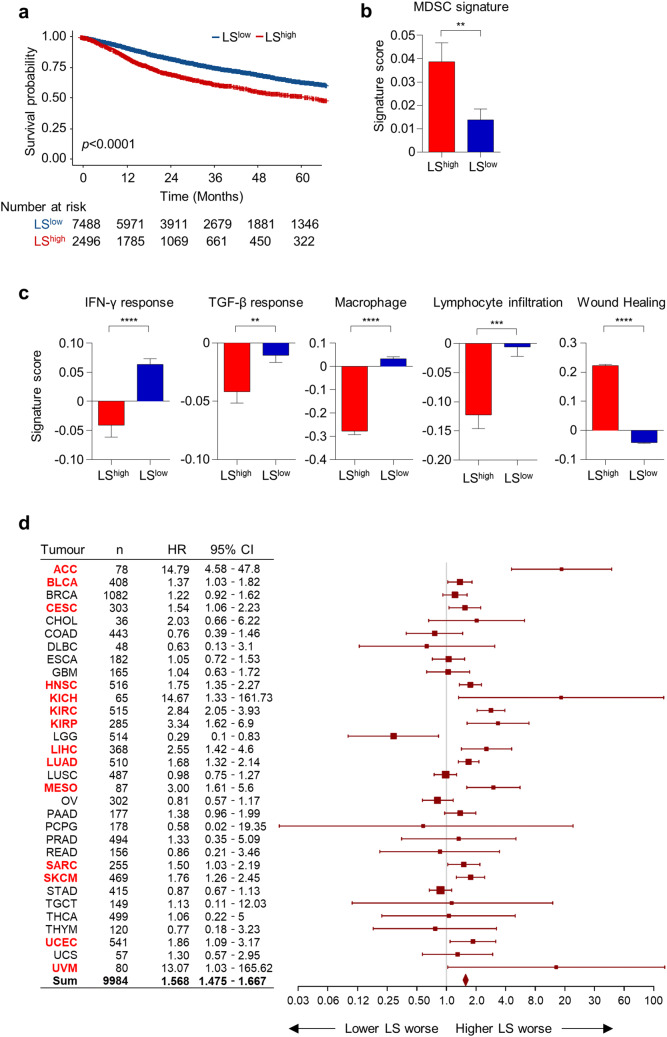
Pan-cancer analysis of LShigh and LSlow tumors. a Overall survival of patients with LShigh and LSlow tumors in the TCGA pan-cancer cohort (n = 9984). b Immunosuppressive MDSC gene signature scores in the LShigh (n = 2496) and LSlow (n = 7488) tumors. c Signature scores for the IFN-γ response, the TGF-β response, macrophage, lymphocyte infiltration, and wound healing signatures in LShigh (n = 2496) and LSlow (n = 7488) tumors. d Forest plot demonstrating the hazard ratio and 95% CI of the LS in overall survival among 32 types of solid tumors. Tumor types with a significant association between overall survival and the LS are marked in red. Bar graphs represent mean and s.e.m. Student’s t-test (b, c). Cox regression analysis (d). **, P < 0.01; ***, P < 0.001; ****, P < 0.0001

