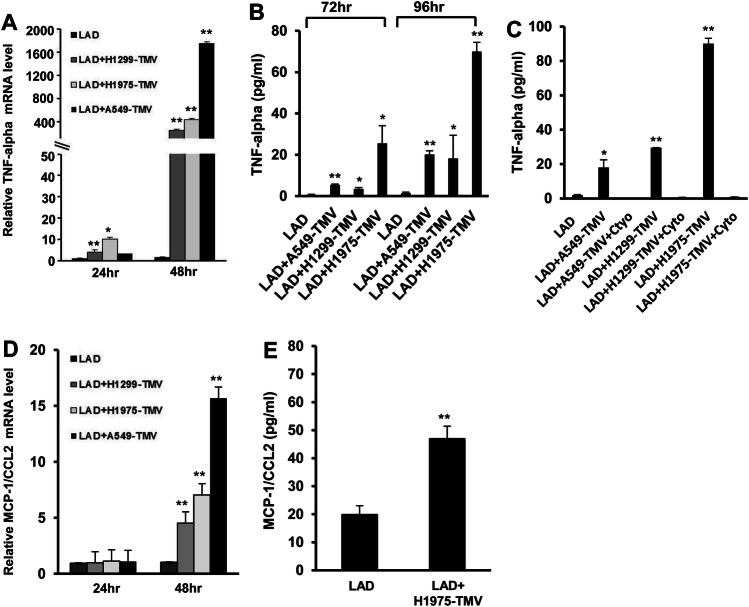
Fig. 3.
Effect of NSCLC-TMV on cytokine release. LAD2 cells stimulated with 100 μg/ml H1299- H1975- or A549-TMV. TNF-α mRNA expression was measured with real time PCR (a) and its release was assayed by ELISA (b). TNF-α release in activated LAD2 cells, with or without pretreatment with cytochalasin D (20 μm) (c). MCP-1/CCL2 mRNA expression levels (d) or MCP-1/CCL2 release (e) in LAD2 cells stimulated, as indicated. mRNA was assayed using real time PCR and normalized to β-glucuronidase expression (GUSB). Data are presented as mean ± S.E. of three independent experiments done in duplicate (*P < 0.05; **P < 0.01)

