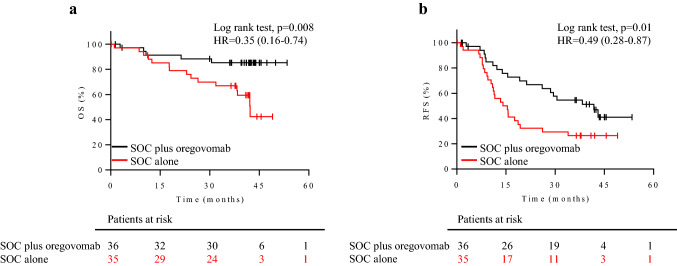
Fig. 2.
Clinical efficacy for the patient cohort included in the present study. a OS and b RFS curves are illustrated for patients stratified by treatment. Black lines: patients on SOC + oregovomab (36 patients). Red lines: patients on SOC alone (35 patients). The corresponding hazard ratio (HR), the associated 95% confidence interval and p values are shown in each graph. Censored patients are indicated on the curves. The number of patients at risk in each group at individual timepoints is also included

