Fig. 4.
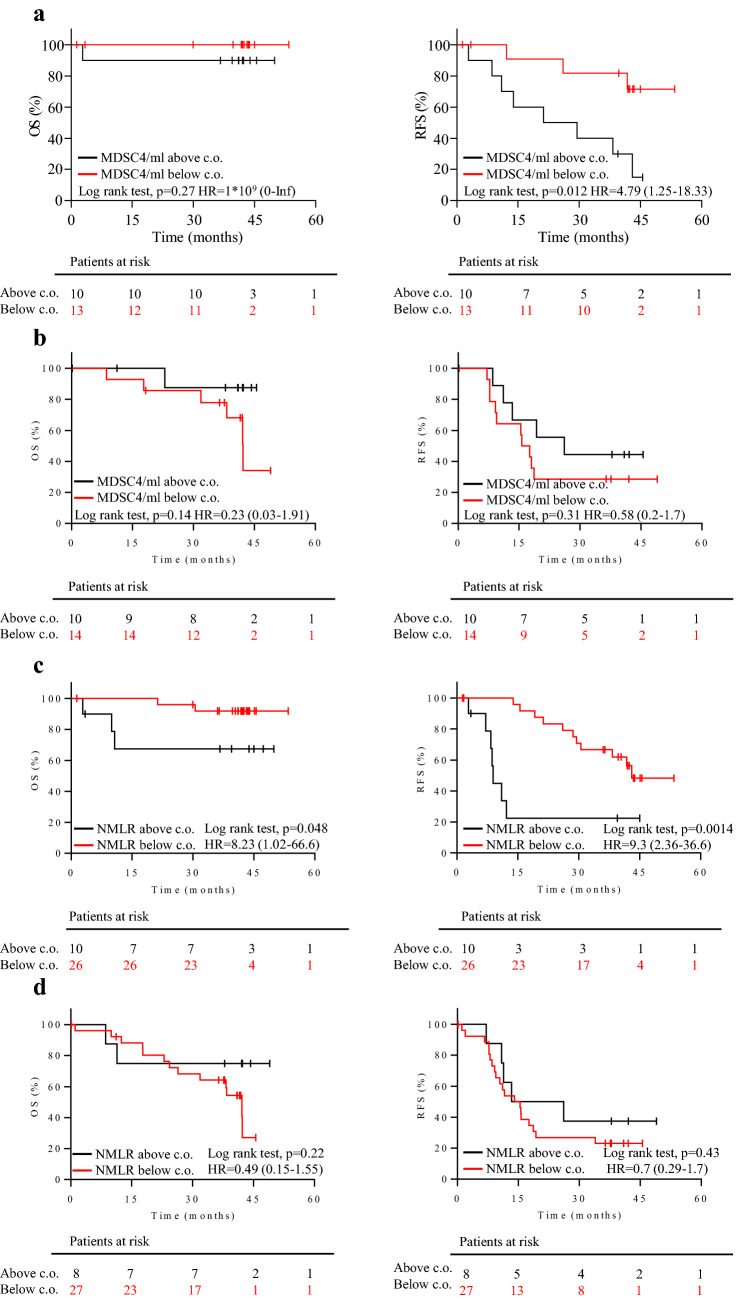
Predictive markers of clinical efficacy. a–b Kaplan–Meier survival analysis in patients stratified according to the baseline MDSC4 count. OS and RFS, left and right panel, respectively, in patients in the SOC + oregovomab (a) and SOC alone (b) treatment arms. Patients were stratified according to their distribution around the MDSC4 count cutoff of 137,300 cells/ml. Red lines: patients with MDSC4 count below the cutoff. Black lines: patients with MDSC4 count above the cutoff. c–d Kaplan–Meier survival analysis in patients stratified according to baseline values of NMLR. OS and RFS, left and right panel, respectively, in patients in the SOC + oregovomab (c) and SOC alone (d) treatment arms. Patients were stratified according to their distribution around the NMLR cutoff of 4.388. Red lines: patients with NMLR below the cutoff. Black lines: patients with NMLR above the cutoff. The corresponding hazard ratio (HR), the associated 95% confidence interval and p-values are shown in each graph. In each panel, censored patients are indicated on the curves. The number of patients at risk in each group at individual timepoints is also included. c.o.: cutoff

