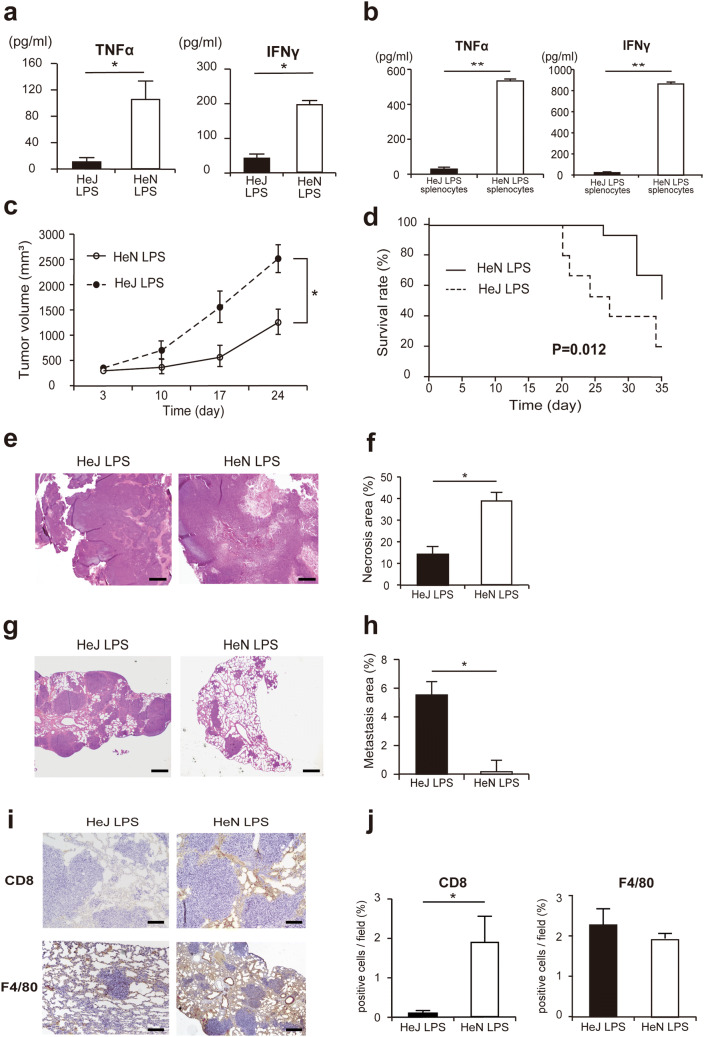
Fig. 2.
In the presence of TLR4 stimulation, C3H/HeN mice show less growth of LM8 cells than C3H/HeJ mice. a Serum concentrations of TNFα and IFNγ in C3H/HeN and C3H/HeJ mice 6 h after LPS administration (n = 5). Values represent means ± S.D. *P < 0.05 by Mann–Whitney U test. b Measurement of TNFα and IFNγ concentration in culture supernatants by ELISA 24 h after LPS administration to splenocytes from C3H/HeN and C3H/HeJ mice (n = 5). Values represent means ± S.D. **P < 0.01 by Mann–Whitney U test. c LM8 tumor volume curve in C3H/HeN and C3H/HeJ mice with LPS-induced TLR4 stimulation (n = 10). Dotted line indicates C3H/HeJ mice treated with LPS and solid line indicates C3H/HeN mice treated with LPS. Values represent means ± S.D. *P < 0.05 by Mann–Whitney U test. d Kaplan–Meier curves for overall survival probability of C3H/HeN and C3H/HeJ mice with LM8 tumors after LPS administration (n = 10). The dotted line indicates C3H/HeJ and the solid line indicates C3H/HeN. A generalized Wilcoxon test was used for statistical analysis. e H&E stain of LM8 tumors, with C3H/HeJ in the left panel and C3H/HeN in the right panel. f Percentage of necrotic area in tumor tissue (n = 10). Values represent means ± S.D. *P < 0.05 by Mann–Whitney U test. Scale bar = 500 µm. g H&E stain of LM8 lung metastases, with C3H/HeJ in the left panel and C3H/HeN in the right panel. h Percentage of metastasis area in lung (n = 10). Values represent means ± S.D. *P < 0.05 by Mann–Whitney U test. Scale bar = 200 µm. i Immunohistochemical staining of LM8 lung metastases of C3H/HeJ (left) and C3H/HeN (right) mice. Upper panels show CD8 staining and lower panels show F4/80 staining. Scale bars = 200 µm. j The percentage of CD8+ (left) and F4/80+ (right) cells in a lobe (n = 10). Values represent means ± S.D. *P < 0.05 by Mann–Whitney U test

