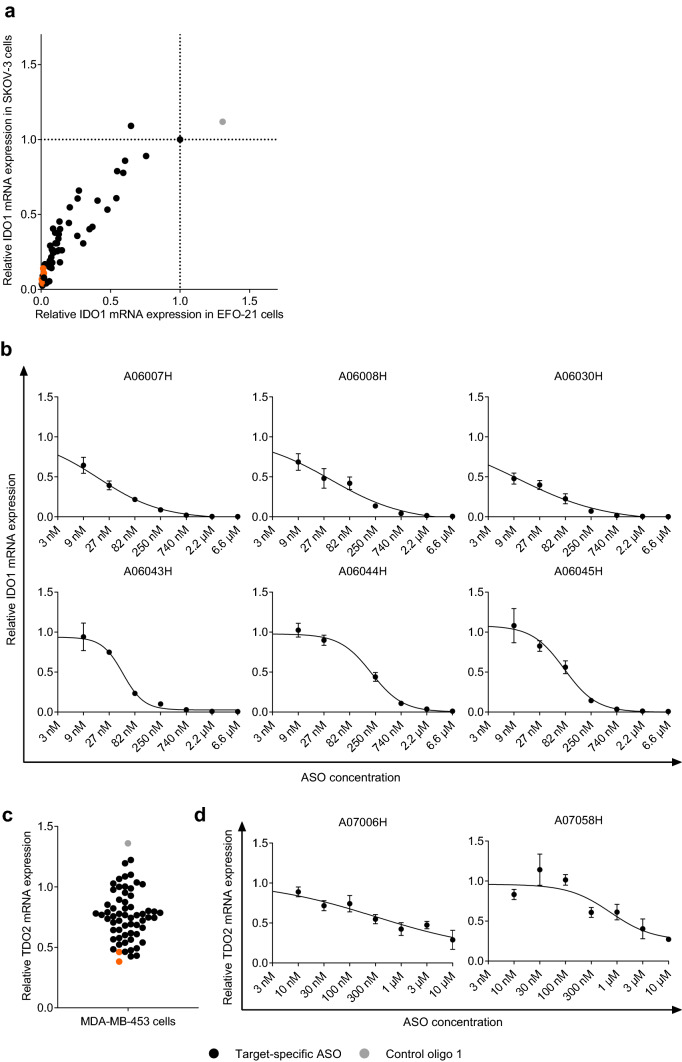
Fig. 1.
Targeting the RNA expression of IDO1 and TDO2 using LNA-modified ASOs. Relative IDO1 (a, b) or TDO2 (c, d) mRNA expression normalized to HPRT1 expression as compared to mock-treated cells (set to 1) is depicted. The mean of technical triplicates is shown. a IDO1 mRNA expression was determined in SKOV-3 and EFO-21 cells that had been treated with IDO1-specific LNA-modified ASOs (black and orange circles) or the control oligo 1 (grey circle) without the use of a transfection reagent for 3 days (concentration: 10 µM). ASOs that were selected for IC50 determination are marked in orange. b IDO1 mRNA expression was determined in EFO-21 cells that had been treated with different concentrations of IDO1-specific LNA-modified ASOs without the use of a transfection reagent for 3 days. IC50 values were determined as described in Materials and Methods and are shown in Table 1. c TDO2 mRNA expression was determined in MDA-MB-453 cells that had been treated with TDO2-specific LNA-modified ASOs (black and orange circles) or the control oligo 1 (grey circle) without the use of a transfection reagent for 3 days (concentration: 5 µM). ASOs that were selected for IC50 determination are marked in orange. d TDO2 mRNA expression was determined in MDA-MB-453 cells that had been treated with different concentrations of TDO2-specific LNA-modified ASOs without the use of a transfection reagent for 3 days. IC50 values were determined as described in Materials and Methods and are shown in Table 2

