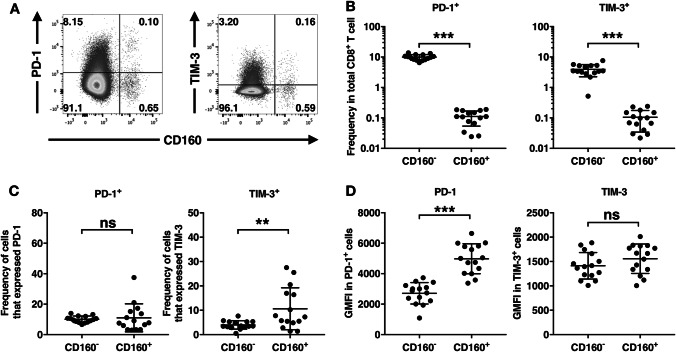
Fig. 1.
Expression of PD-1 and TIM-3 by CD160+ vs. CD160− CD8+ T cells. Fresh circulating CD8+ T cells were stained directly ex vivo. a Representative gating of CD160 vs. PD-1 and CD160 vs. TIM-3 in one representative individual, pre-gated on CD8+ T cells. b Frequencies of PD-1+CD160− and PD-1+CD160+ cells in total CD8+ T cells, and TIM-3+CD160− and TIM-3+CD160+ cells in total CD8+ T cells. c Percent of CD160− or CD160+ CD8+ T cells that expressed PD-1 and TIM-3. d Geometric mead fluorescence intensity (GMFI) of PD-1 and TIM-3 in PD-1+ and TIM-3+ cells, respectively, from CD160− or CD160+ CD8+ T cells. ns not significant. ***p < 0.001

