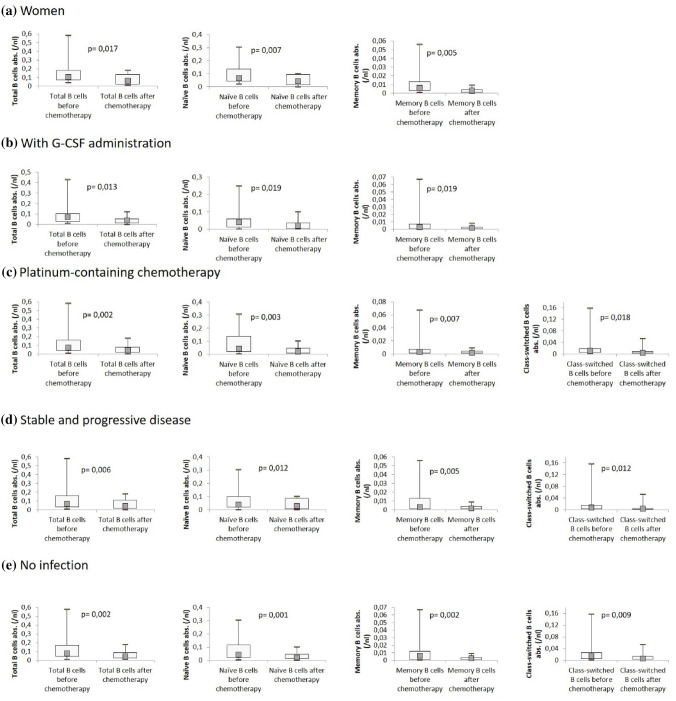
Fig. 4.
B-cell subsets before and after chemotherapy for subgroups with significant changes. Distribution of total numbers of B-cell subsets in the subgroups, analyzed by flow cytometry before and after chemotherapy. a Women, b with G-CSF administration, c platinum-containing chemotherapy, d stable and progressive disease, e no infection. Boxplots show median values as well as interquartile range. P < 0.022 = significant

