Fig. 2.
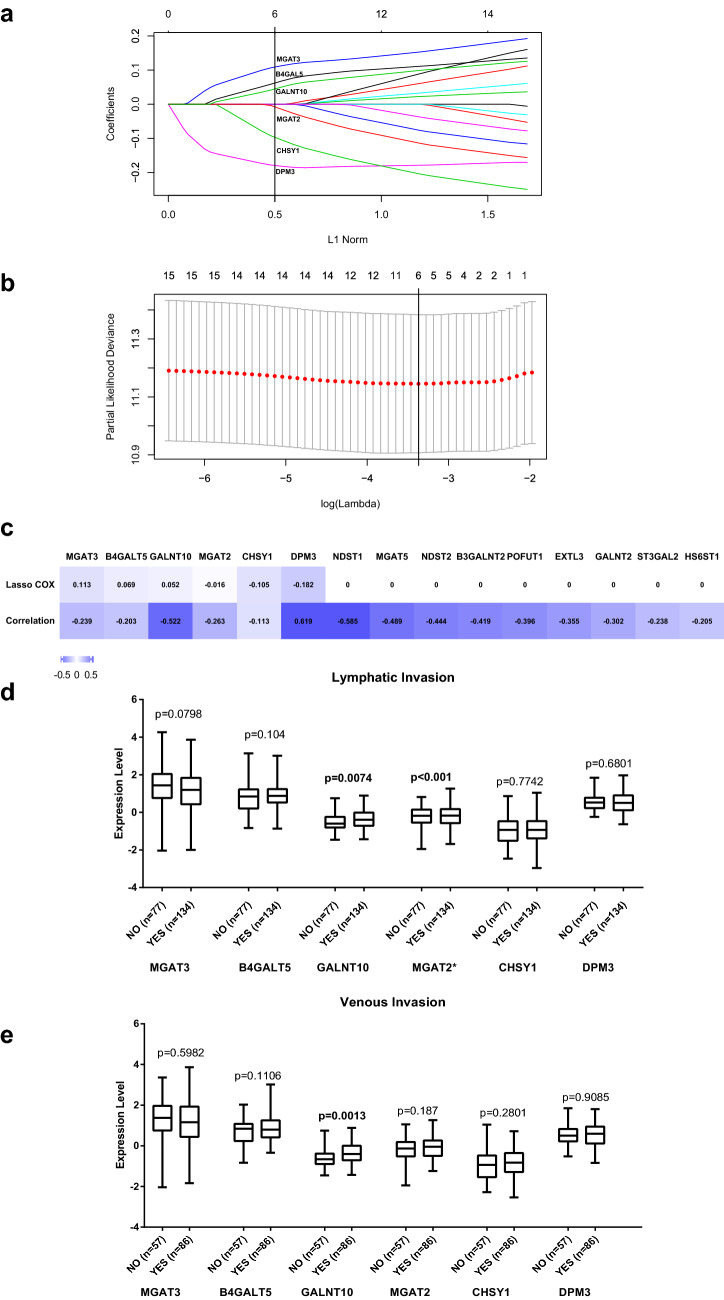
Correlations of the 15 glycogenes with prognosis and tumor invasion in the TCGA cohort. a LASSO Cox regression coefficient profiles of the 15 glycogenes with the OS from the TCGA cohort. A dashed vertical line indicates the value (γ = 0.5) chosen by the fivefold cross-validation of data. b Partial likelihood deviance for the LASSO Cox regression coefficient profiles. A light dashed vertical line indicates the minimum partial likelihood deviance. A bold dashed vertical line indicates the partial likelihood deviance at the value (λ = 0.0378). c LASSO Cox regression coefficients and relative coefficients of the 15-gylcogene signature. Both coefficients were not zero for MGAT3, B4GAT5, GALNT10, MGAT2, CHSY1, and DPM3. Only the p value of CHSY1 was > 0.05. d Association of lymphatic and venous invasion with the expression of MGAT3, B4GAT5, GALNT10, MGAT2, CHSY1, and DPM3. Only GALNT10 was significantly associated with lymphatic and venous invasion (p = 0.0074, p = 0.0013)

