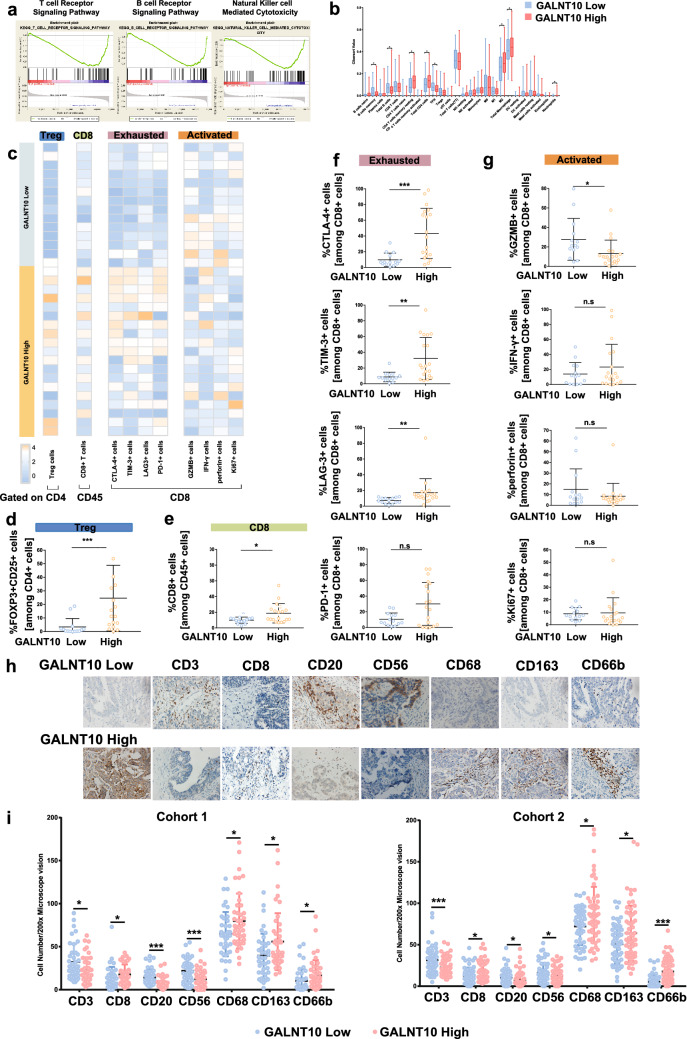
Fig. 4.
GALNT10 expression associates with the immunosuppressive tumor microenvironment. a GSEA KEGG analysis of high and low GALNT10 expression, as follows: T cell receptor signaling pathway, ES = − 0.58, FDR < 105; B cell receptor signaling pathway, ES = − 0.55, FDR = 0.006; NK cell-mediated cytotoxicity, ES = − 0.53, FDR < 105. b The results of CIBERSORT analysis of high and low GALNT10 expression. c Heatmap showing results of the flow cytometric analysis of Tregs, CD8+ T cells, as well as immune exhaustion makers (CTLA-4, TIM-3, LAG3, and PD1) and immune activation makers (GZMB, IFN-α, perforin, and Ki67) in CD8+ T cells of HGSC specimens with low and high GALNT10 expression. d The proportion of FOXP3+ CD25+ cells in CD4+ T cells of HGSC specimens with low and high GALNT10 expression. e The proportion of CD8+ T cells in CD45+ cells of HGSC specimens with low and high GALNT10 expression. f The proportion of immune exhaustion markers (CTLA-4, TIM-3, LAG3, and PD1) in CD8+ T cells of HGSC specimens with low and high GALNT10 expression. g The proportion of immune activation makers (GZMB, IFN-α, perforin, and Ki67) in CD8+ T cells of HGSC specimens with low and high GALNT10 expression. h Representative images of GALNT10, CD3, CD8, CD20, CD56, CD68, CD163, and CD66b staining in HGSC specimens (40 ×). i Comparison of CD3, CD8, CD20, CD56, CD68, CD163, and CD66b staining in high and low GALNT groups from cohort 1 and 2 (*p < 0.05; **p < 0.01; ***p < 0.001; n.s., not significant)

