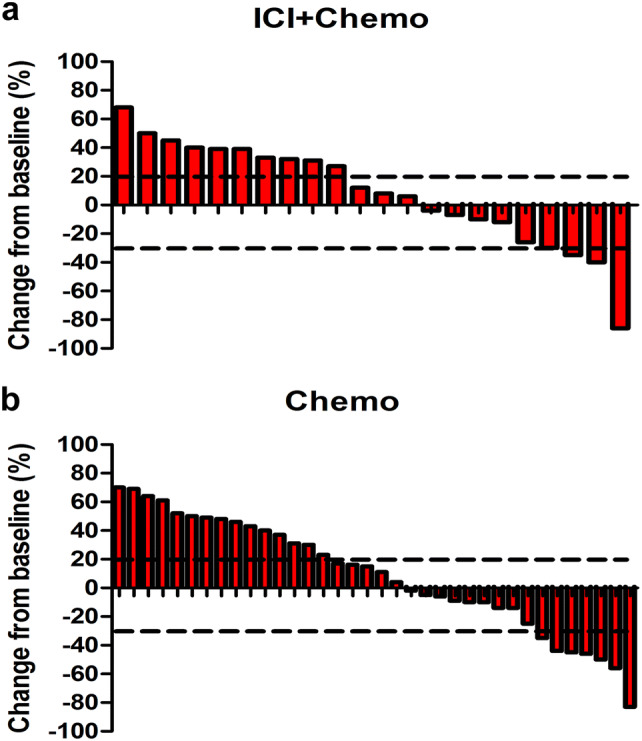
Fig. 3.

Waterfall plots of the best percentage change. a The best percentage change in tumor size from baseline for individual patients in the combination immunotherapy group. b The best percentage change in tumor size from baseline for individual patients in the chemotherapy group. ICI + chemo the group of patients receiving immune checkpoint inhibitors and chemotherapy, Chemo the group of patients receiving chemotherapy
