Fig. 2.
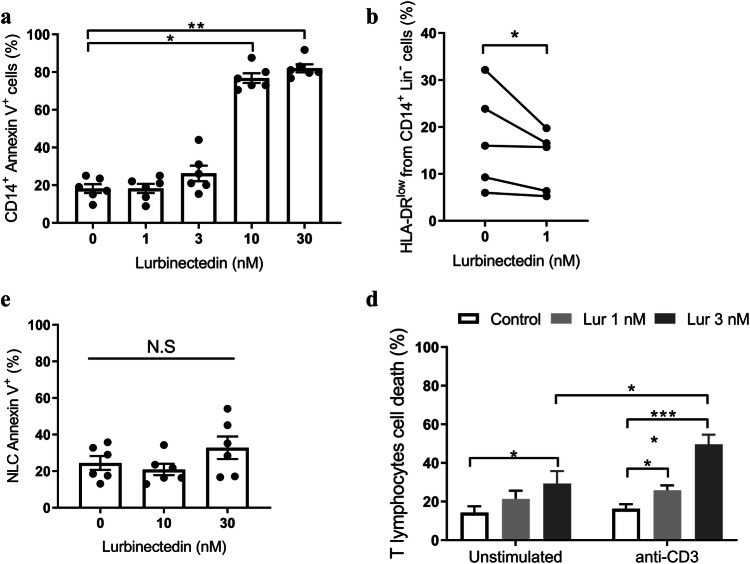
Effects of Lurbinectedin on tumor-microenvironment cells. a Monocytes were treated with different concentrations of Lurbinectedin for 24 h. Cell death was determined by Annexin V-FITC staining and flow cytometry analysis. The individual values and the mean ± SEM are shown, n = 6. b The sensitivity of Mo-MDSC to Lurbinectedin was determined by incubating PBMC with or without Lurbinectedin 1 nM for 24 h. Cells were stained with anti-CD3 PECy5, anti-CD19 PECy5, anti-CD56 PeCy5, anti-CD14-PE and anti-HLA-DR-FITC antibodies. Mo-MDSC population was selected as Lin− (CD3−, CD19−, CD56−), CD14+ and HLA-DRlow. c NLC were incubated with vehicle, Lurbinectedin 10 or 30 nM for 24 h. Then, cells were labeled with Annexin V-FITC and analyzed by flow cytometry. The individual values and the mean ± SEM are shown, n = 6. d CLL PBMC were plated over immobilized anti-CD3 antibody (anti-CD3i) or isotype control. After 48 h of incubation, Lurbinectedin or vehicle were added for another 72 h of culture. Finally, cells were labeled with anti-CD4-PECy5 and anti-CD8-PE antibodies and analyzed by flow cytometry. The percentage of total non-viable T lymphocytes after 5 days of culture is shown (mean ± SEM), n = 11. Statistical significance was determined by the Friedman test followed by Dunn’s post-test of multiple comparisons (a, c and d) or Wilcoxon signed-rank test (b). Lur Lurbinectedin, N.S no statistically significant difference, *p < 0.05; **p < 0.01; ****p < 0.0001

