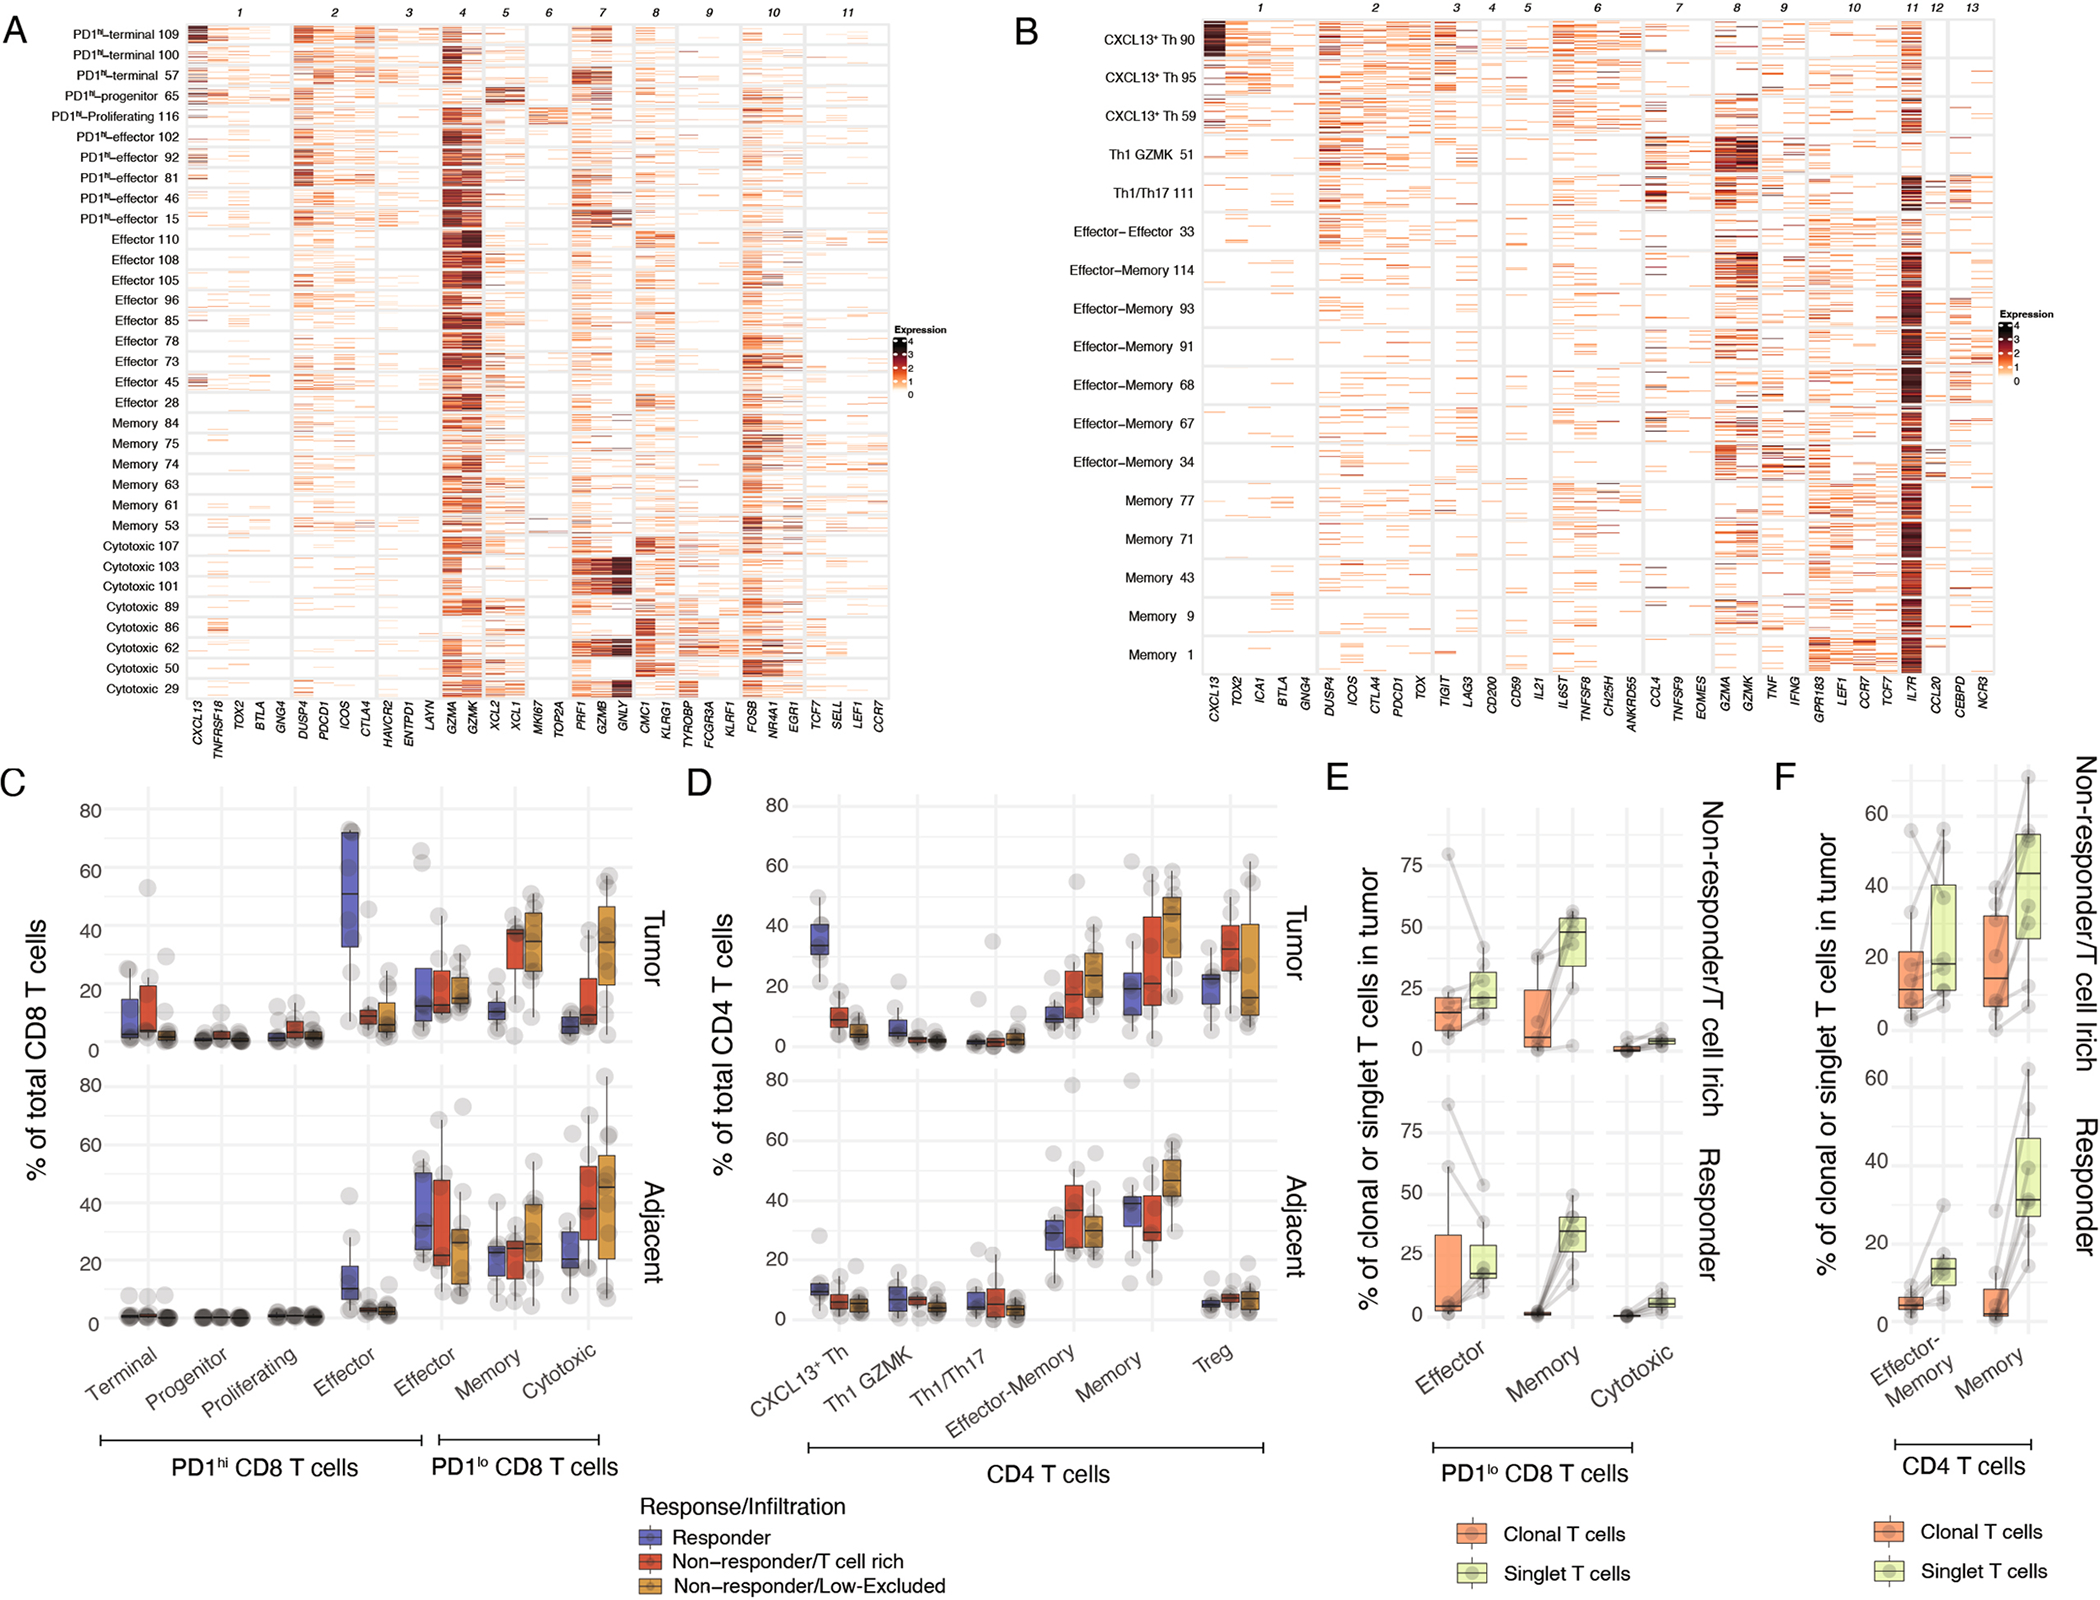
Extended Data Fig. 2 |. Molecular profiling of expanded CD8+ and CD4+ T cell clones associated with response to PD-1 blockade.

Surgically resected HCC lesions were isolated after two or more doses of PD-1 blockade and analyzed by single-cell RNA and TCR sequencing (scRNAseq and scTCRseq, N = 29 and N = 21 biologically independent samples, respectively). (A, B) Expression of cluster-defining gene modules by scRNAseq for (A) CD8+ (B) CD4+ T cell clusters showing number of UMI per cell. (C, D) Cluster frequencies among (C) CD8+ and (D) CD4+ T cells in tumor and adjacent tissue, stratified by response and T cell infiltration pattern. (E) Cluster frequencies among PD-1lo CD8+ T cells in tumor among tumor-enriched clonal T cells and tumor singlet T cells, stratified by response and T cell infiltration pattern. (F) Cluster frequencies among CD4+ T cells in tumor among tumor-enriched clonal T cells and tumor singlet T cells, stratified by response and T cell infiltration pattern. Dots represent individual study subjects. The box plot center line represents the median; box limits represent the interquartile range (IQR); whiskers represent the minimum and maximum observations greater and lesser than the IQR plus 1.5 × IQR, respectively.
