
Extended Data Fig. 4 |. Spatial localization of CXCL13+ Th, Progenitor CD8+ T cells and mregDC.
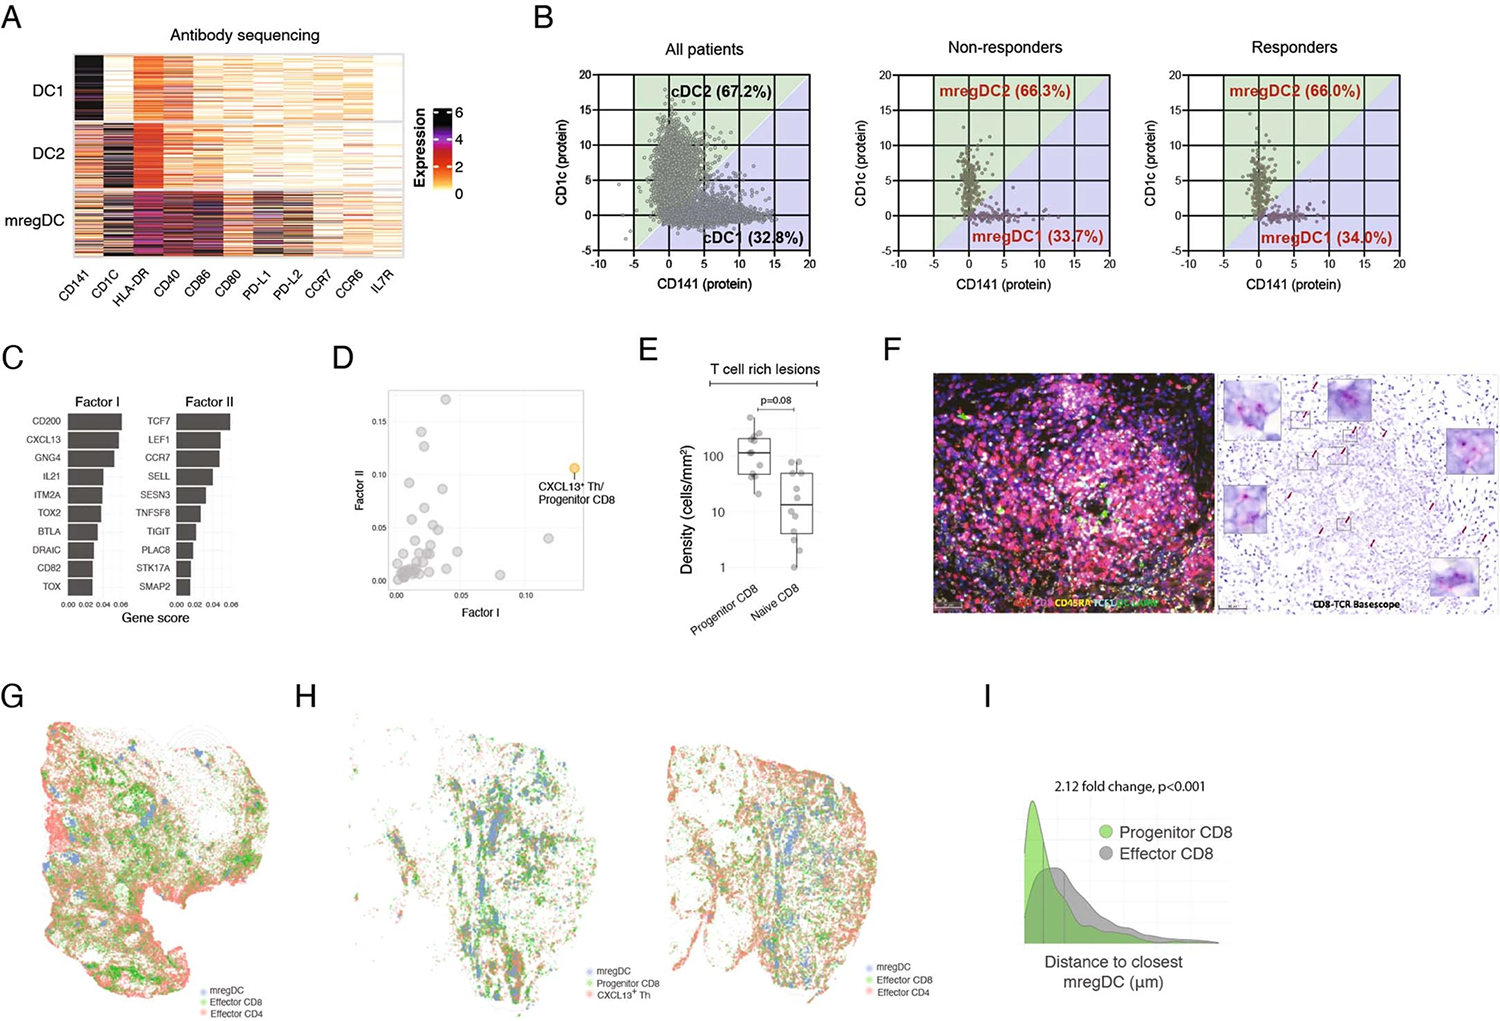
(A, B) CITEseq antibody sequencing analysis of DCs. (A) Expression of DC cluster-defining proteins by showing number of UMI per cell. (B) Gating of CD141 (as a marker of DC1) and CD1c (as a marker of DC2) among resting DC (left) and mregDCs (middle and right). (C–I) Post treatment HCC tissue sections analyzed by MERFISH, multiplex IHC, IF and BaseScope for spatial distribution of T cell subsets and mregDC. (C) MERFISH factor analysis gene scores for selected factors, showing top 10 genes per factor. (D) Quantification of factor activation from (C), defined as average gene expression per cluster. (E) Densities of Progenitor (CD3+CD8+TCF1+ CD45RA−) and naive (CD3+CD8+TCF1+ CD45RA+) CD8+ T cells among T cell rich lesions (N = 12 biologically independent samples. Two-sided T test. Dots represent individual study subjects. The box plot center line represents the median; box limits represent the interquartile range (IQR); whiskers represent the minimum and maximum observations greater and lesser than the IQR plus 1.5 × IQR, respectively). (F) IHC (left) and BaseScope analysis (right) of a representative immune aggregate in responder patient showing CD8+ clones accumulation (N = 1). (G, H) Spatial distribution of mregDC (DCLAMP+), Effector CD8+ T cell (CD3+CD8+TCF1− CD45RA−), Effector CD4+ (CD3+CD8−TCF1− CD45RA−) and CXCL13+ Th (CD3+CD8−TCF1+ CD45RA−), and Progenitor CD8+ (CD3+CD8+TCF1+ CD45RA−) and CXCL13+ Th (CD3+CD8−TCF1+ CD45RA−) in two different responder patients, showing computational rendering of IF with density contour annotation for mregDC (DCLAMP+). (I) Distribution of Progenitor (CD3+CD8+TCF1+ CD45RA−) and Effector (CD3+CD8+TCF1− CD45RA−) CD8+ T cell proximities to mregDC (DCLAMP+), showing histograms of individual cells from a representative responder, vertical gray bars represent the median.