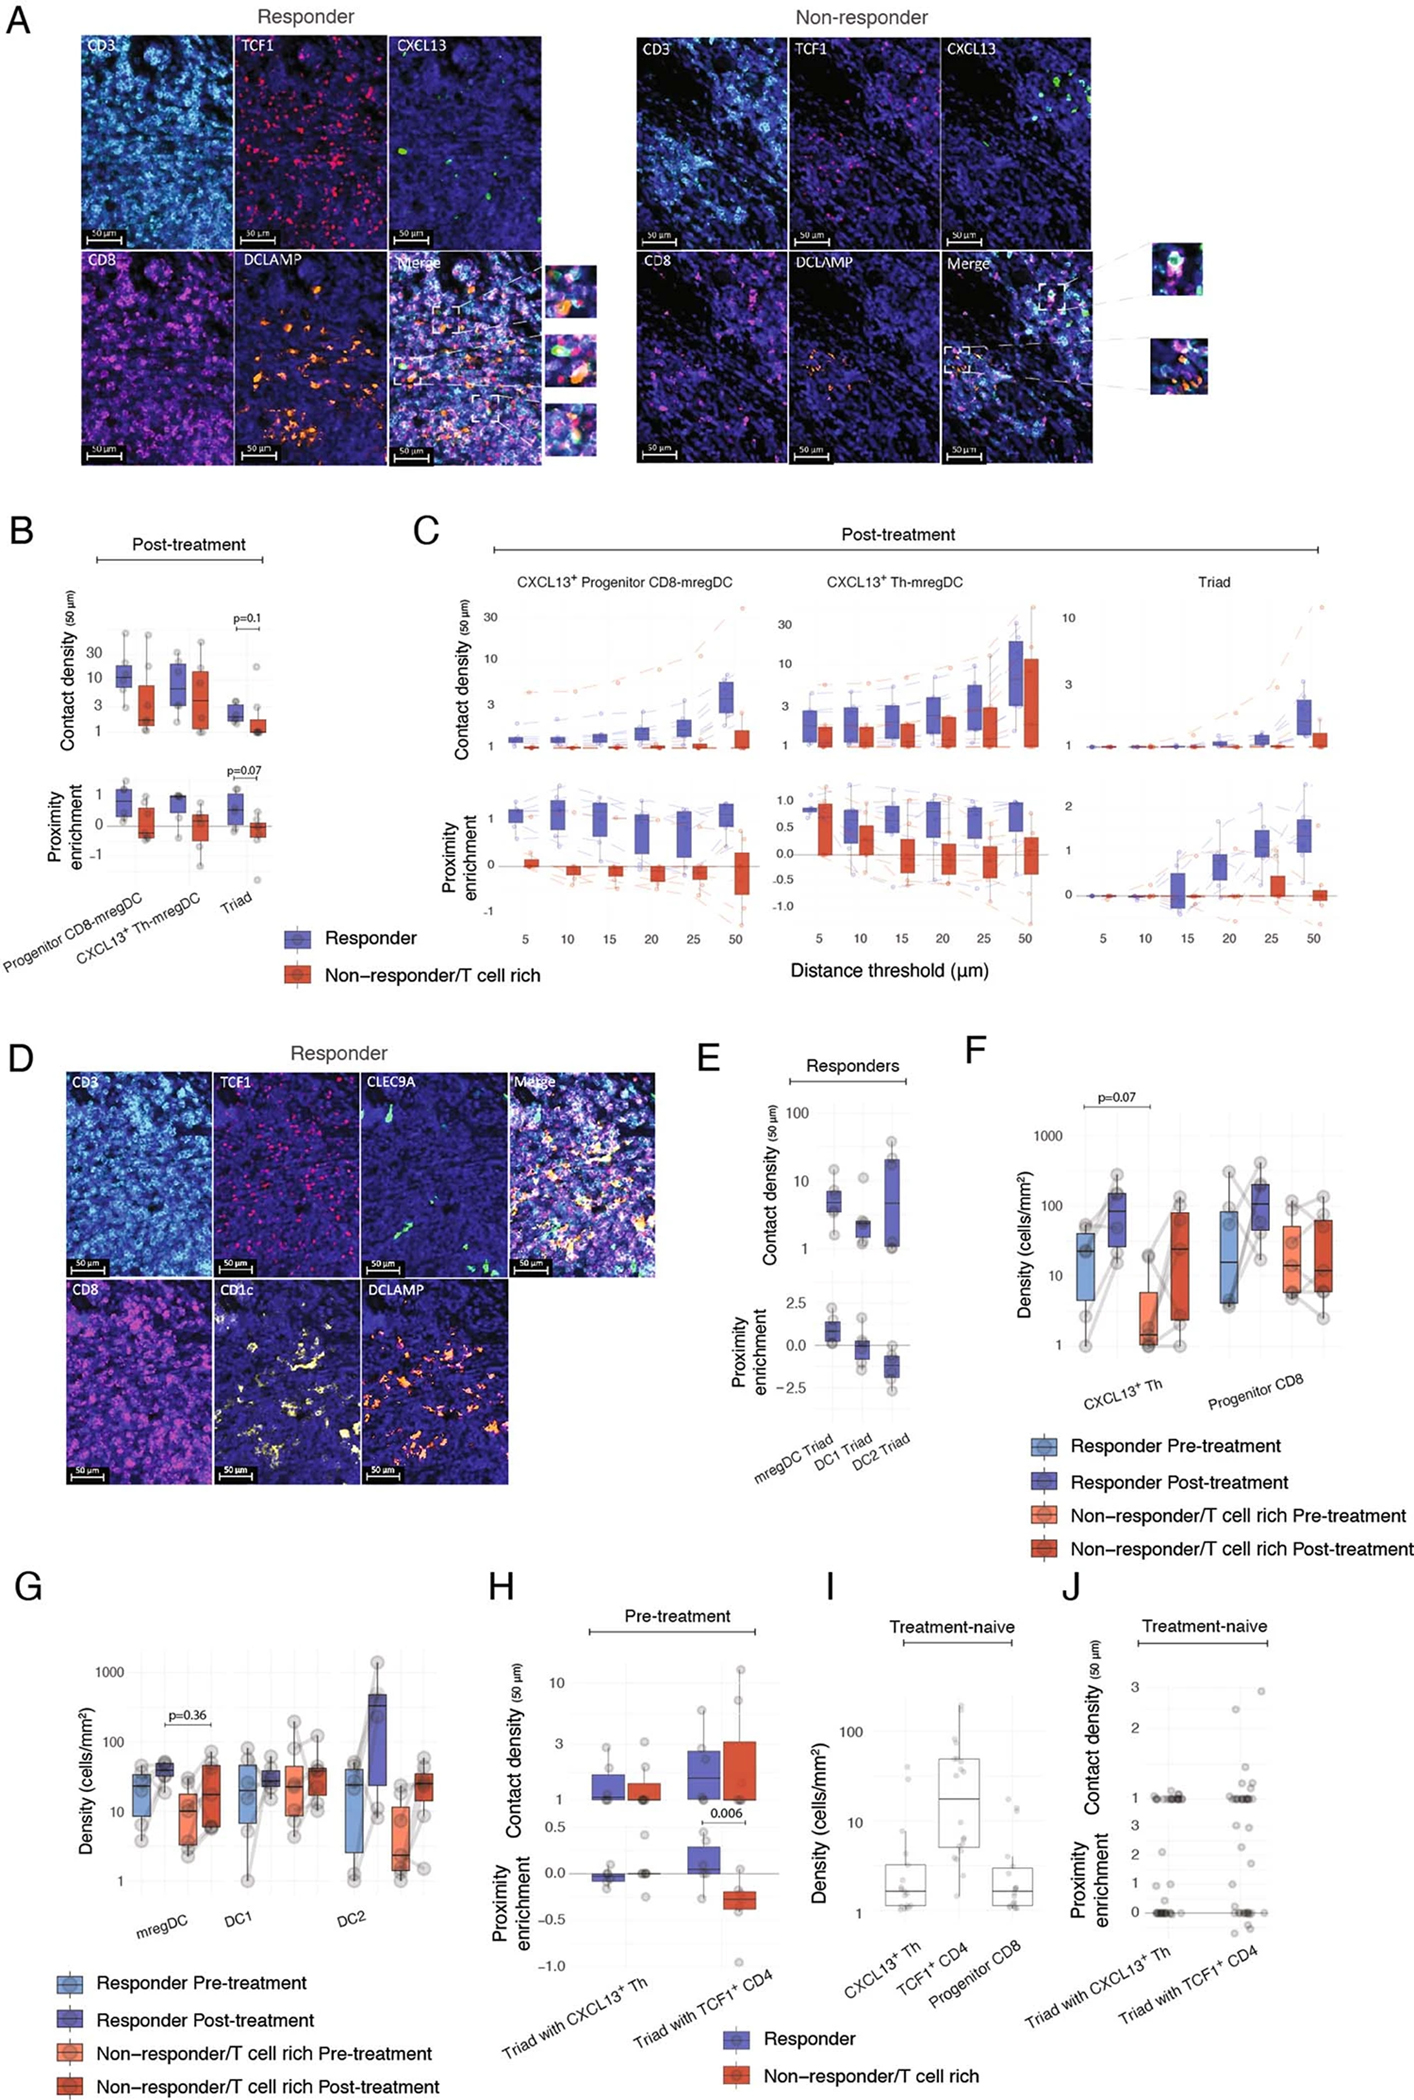
Extended Data Fig. 5 |. Spatial localization of CXCL13+ Th, Progenitor CD8+ T cells and mregDC.

(A–J) Multiplex IF analysis of treatment-naïve HCC lesions (N = 20 biologically independent samples), Surgically resected HCC lesions during treatment with PD-1 blockade (N = 13 biologically independent samples) and HCC tumor biopsies (N = 13 biologically independent samples). (A) Representative images of an mregDC niche, analyzed by IF for T cell markers, in a representative responder (left) and T cell rich non-responder (right). (B) Spatial proximity enrichment analysis of Progenitor CD8+ (CD3+CD8+TCF1+), CXCL13+ Th (CD3+CD8−CXCL13+) and mregDC (DCLAMP+) post-treatment (Two-sided Mann–Whitney U test). (C) Robustness analysis showing spatial proximity patterns across increasing distance thresholds, for pairs and triads post-treatment. (D) Representative images of a niche, analyzed by IF for DC subsets including DC1 (CLEC9A), DC2 (CD1c) and mregDC (DCLAMP). (E) Spatial proximity enrichment analysis showing contact densities (top) and relative enrichment (bottom) at distance of up to 50 μm between Progenitor CD8+ T cell (CD3+CD8+TCF1+) and CXCL13+ Th (CD3+CD8−TCF1+) triads with mregDC (DCLAMP+), DC1 (CLEC9A+) and DC2 (CD1C+), in 6 responders post-treatment. (F-G) Cellular densities of (F) Progenitor CD8+ T cells (CD3+CD8+TCF1+) and CXCL13+ Th (CD3+CD8−CXCL13+) and (G) mregDC (DCLAMP+), DC1 (CLEC9A+) and DC2 (CD1C+) across responders, T cell rich non-responders, pre and post-treatment (Two-sided Mann–Whitney U test). (H) Spatial proximity enrichment analysis of Progenitor CD8+ T cells (CD3+CD8+TCF1+) and mregDC (DCLAMP+) with CXCL13+ Th (CD3+CD8−CXCL13+) or TCF1+ CD4+ T cells (CD3+CD8−TCF1+) in pre-treatment biopsies (Two-sided Mann–Whitney U test). (I) Cellular densities of CXCL13+ Th (CD3+CD8−CXCL13+), TCF1+ CD4+ T cells (CD3+CD8−TCF1+) and Progenitor CD8+ T cells (CD3+CD8+TCF1+) in treatment-naive patients. (J) Spatial proximity enrichment analysis of Progenitor CD8+ T cells (CD3+CD8+TCF1+) and mregDC (DCLAMP+) with CXCL13+ Th (CD3+CD8−CXCL13+) or TCF1+ CD4+ T cells (CD3+CD8−TCF1+) in treatment-naive patients. Dots represent individual study subjects. The box plot center line represents the median; box limits represent the interquartile range (IQR); whiskers represent the minimum and maximum observations greater and lesser than the IQR plus 1.5×IQR, respectively.
