Fig. 2.
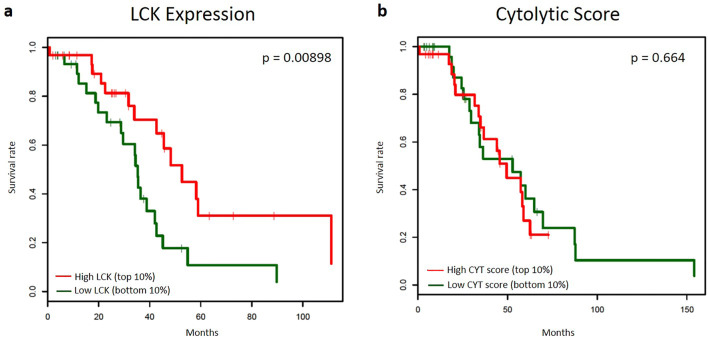
Kaplan–Meier analysis comparing the prognostic ability of LCK and CYT. a Kaplan–Meier analysis of overall survival in high LCK expression (top 10%, red) as compared to low LCK expression (bottom 10%, green). b Kaplan–Meier analysis of overall survival in high CYT score (top 10%, red) as compared to low CYT score (bottom 10%, green)

