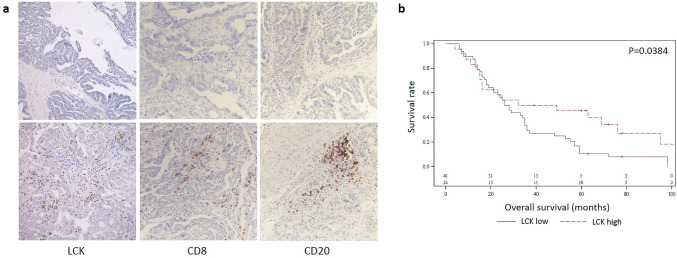
Fig. 3.
LCK expression and survival analysis in an independent cohort. a Representative examples of varying LCK, CD8, CD20 expression by immunohistochemistry. Top row = low expression (from left to right: LCK, CD8, CD20). Bottom row = high expression (from left to right: LCK, CD8, CD20). b Kaplan–Meier analysis of overall survival in high LCK expression (red) as compared to low LCK expression (blue)

