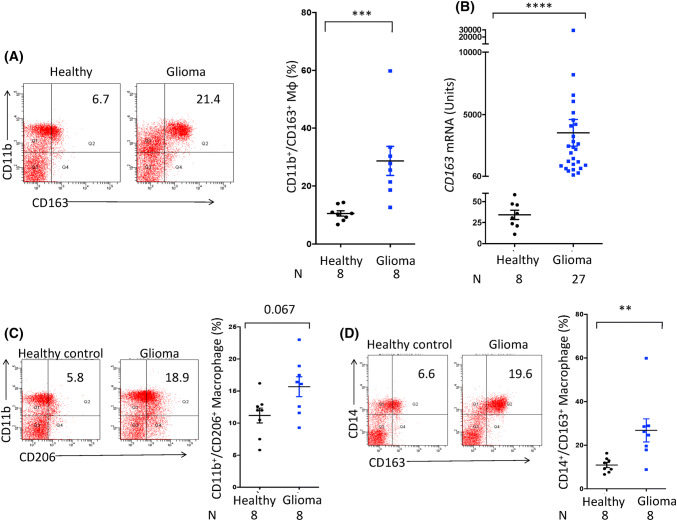
Fig. 4.
Higher frequency of M2 macrophages is reflected in the peripheral blood of the glioma patients. The PBMCs obtained from the glioma patients and healthy subjects were monitored for the expression of CD163 by a flow cytometer on CD11b gated population and data expressed as dot plots; b RT-qPCR and data expressed as arbitrary units after normalization and denoted as mean ± SEM. The PBMCs were also evaluated for the expression of c CD11b and CD206; d CD14 and CD163. The data expressed as dot plots depict a percentage of double-positive cells. The vertical scatter plot on the right panel shows percentage of double-positive cells and expressed as mean ± SEM. Each dot represents single individual. *p < 0.05; **p < 0.01; ***p < 0.0001. ‘N’ represents number of individuals

