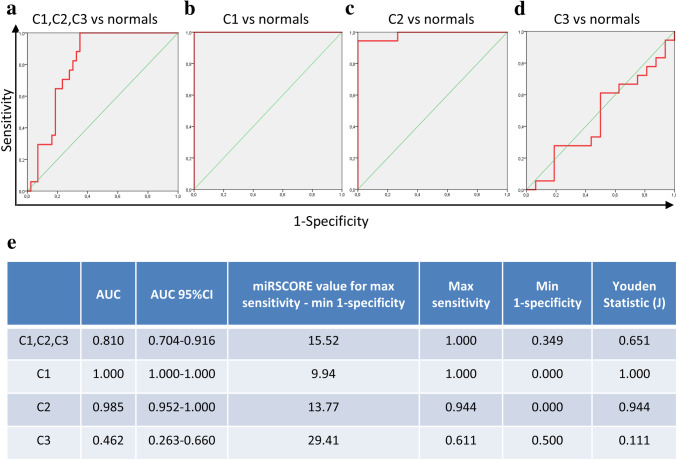
Fig. 5.
Receiver operating characteristic (ROC) curve analysis of our clusters. ROC curves showing the distinction of C1, C2, C3 patients (a), C1 (b), C2 (c) and C3 (d) BCa patient algorithm values, with those of normal donors. Table (e) presents some of the important ROC curve metrics such as the AUC (with the 95%CI), the algorithm value at which the best combination of sensitivity–specificity is reached along with the coordinates of this curve point (max sensitivity, min 1-specificity) as well as the Youden statistic (J)

