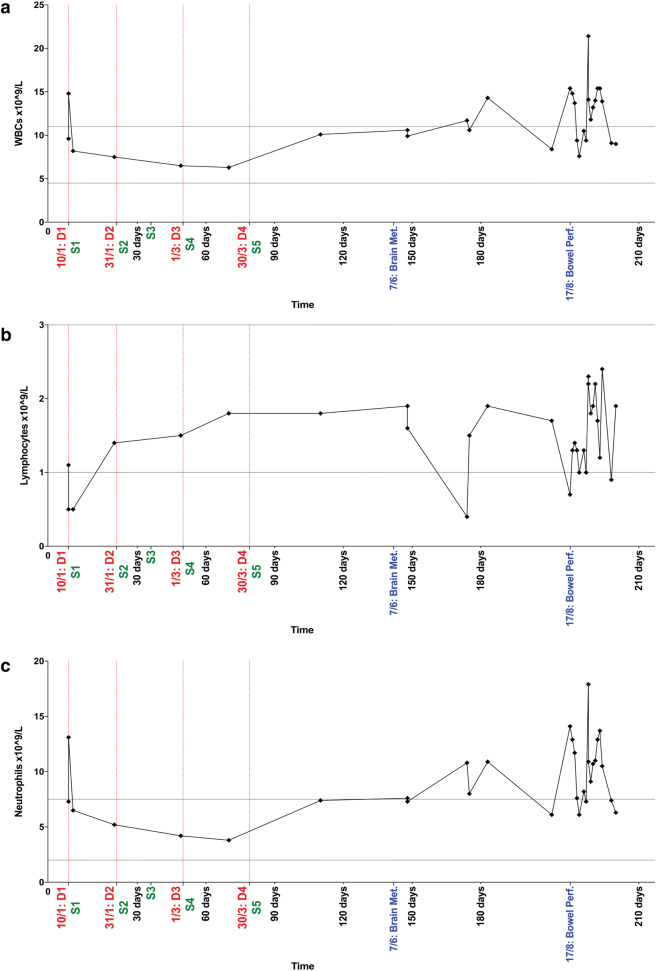
Fig. 4.
Longitudinal levels (× 109/L blood) of white blood cells (WBCs) (a) lymphocytes (b) and neutrophils (c) in ATC patient treated with pembrolizumab. Date of dose administration is indicated by the vertical red dotted lines. Normal value ranges are indicated by the horizontal grey lines (WBCs: 4.5–11 × 109/L (a), lymphocytes: 1–3 × 10⁹/L (b), neutrophils: 2–7 × 10⁹/L (c)). Clinically significant events have been included on the x-axis. D dose. S sample collection

