Fig. 2.

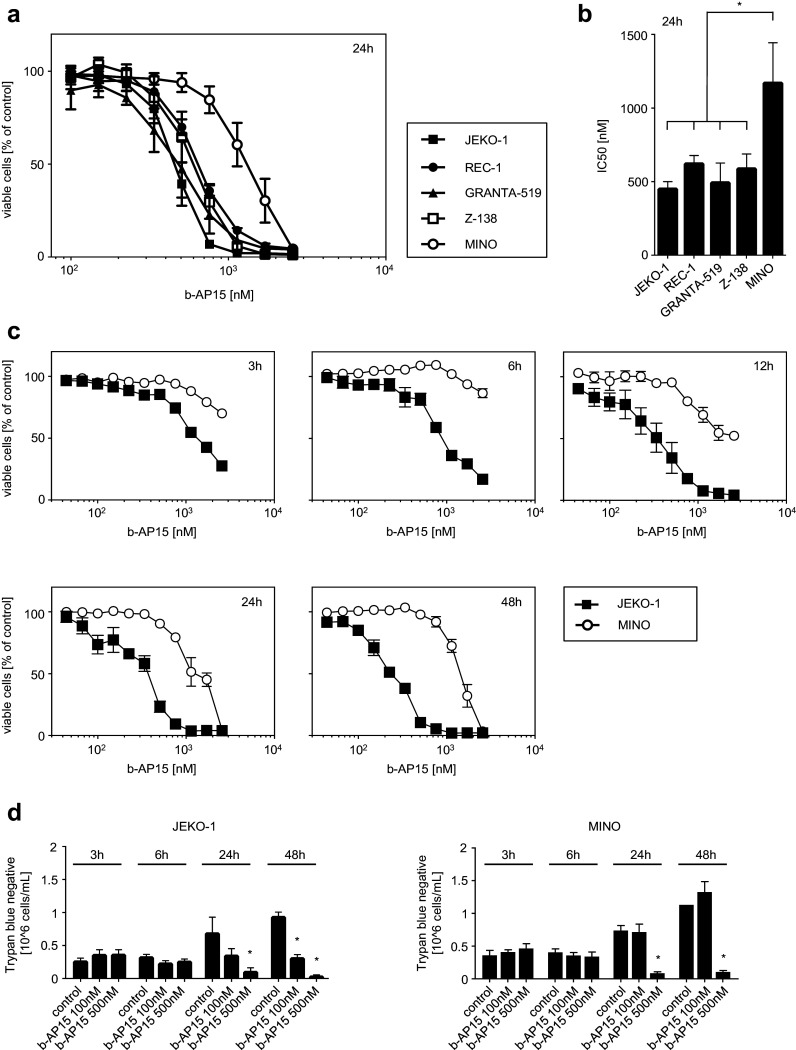
b-AP15 treatment reduces viability of MCL cells. MCL cells were exposed to the indicated concentrations of b-AP15 or DMSO as vehicle control. At the indicated time of incubation, cell viability was analyzed using WST-1 assays (a–c) and trypan blue staining (d). a Data are presented as percentage of control. Points represent means of three technical replications; bars represent SD. One representative result of at least three experiments with similar results is shown. b IC50 values were calculated from log concentration curves using non-linear regression analysis (variable slope model with a four-parameter dose–response curve). Data are presented as means of three independent experiments; bars represent SD. One-way ANOVA followed by Tukey’s test was used to determine significant differences in mean IC50 values between cell lines (*p < 0.05). c Data are presented as percentage of control. Points represent means of three technical replications; bars represent SD. One representative result of at least three experiments with similar results is shown. d Data are presented as number of trypan blue negative cells; results of three technical replicates are shown; bars represent SD. Student’s t test was used to determine statistical significant differences between control and treated cells. (*p < 0.05)
