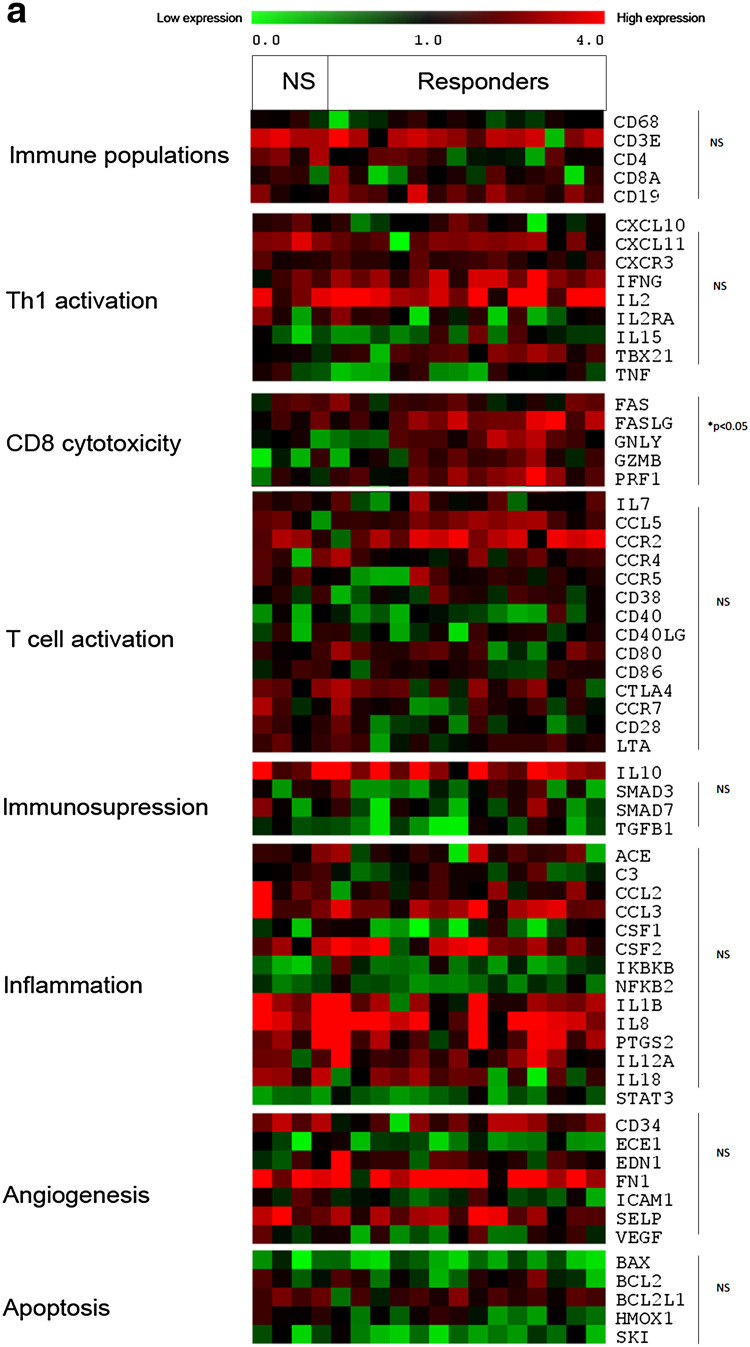
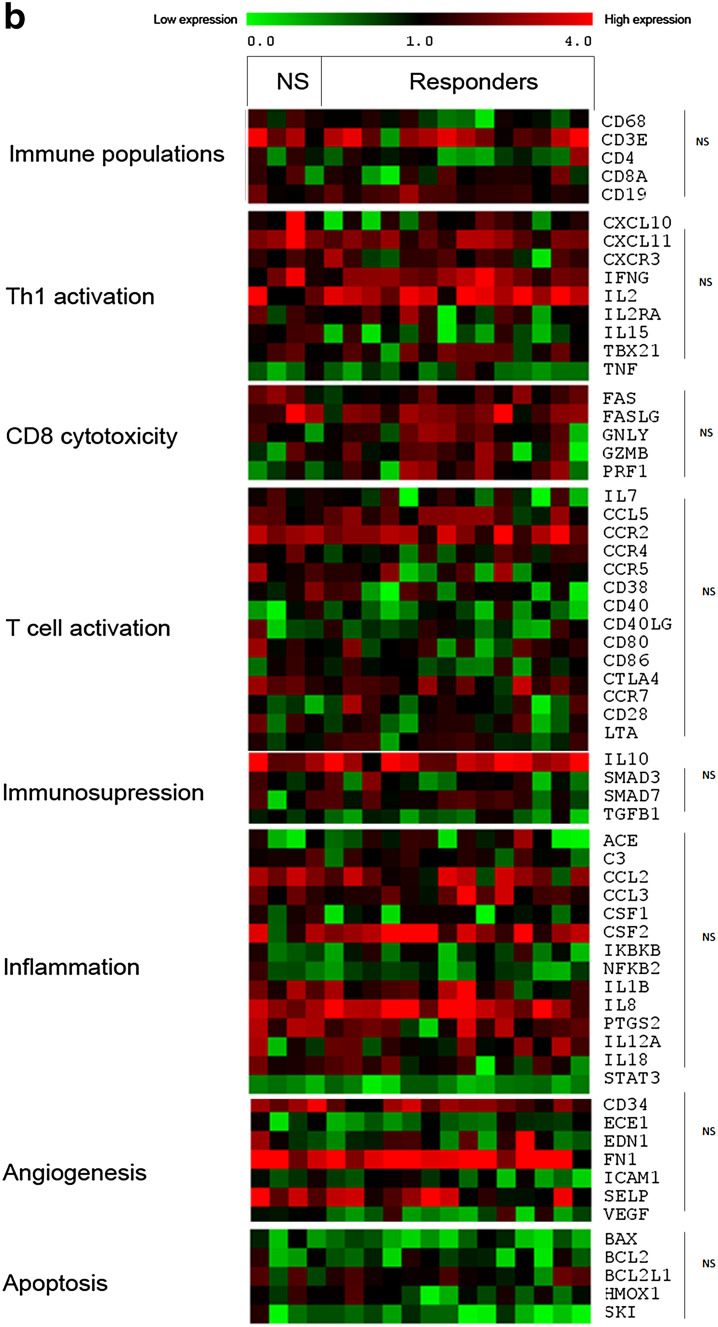
Fig. 4.
Gene expression levels related to Immune populations, Th-orientation, cytotoxicity, T cell activation, Immunosuppression, inflammation, and angiogenesis according to the patient clinical status. Gene expression levels were assessed by qRT-PCR and were determined using threshold cycle values normalized to the reference genes in 18 patients (4 were classified based on clinical data as non-responders, and 14 were classified as responders). The heat map representation of clusters of genes related to different immune populations, T cell activation, immunosuppression, inflammation, and angiogenesis before and after treatment with DCVAC/PCa is shown in a and b, respectively. The minimal level of expression (green) to the maximal level (red) is shown. Statistical analysis was performed using unpaired T-test


