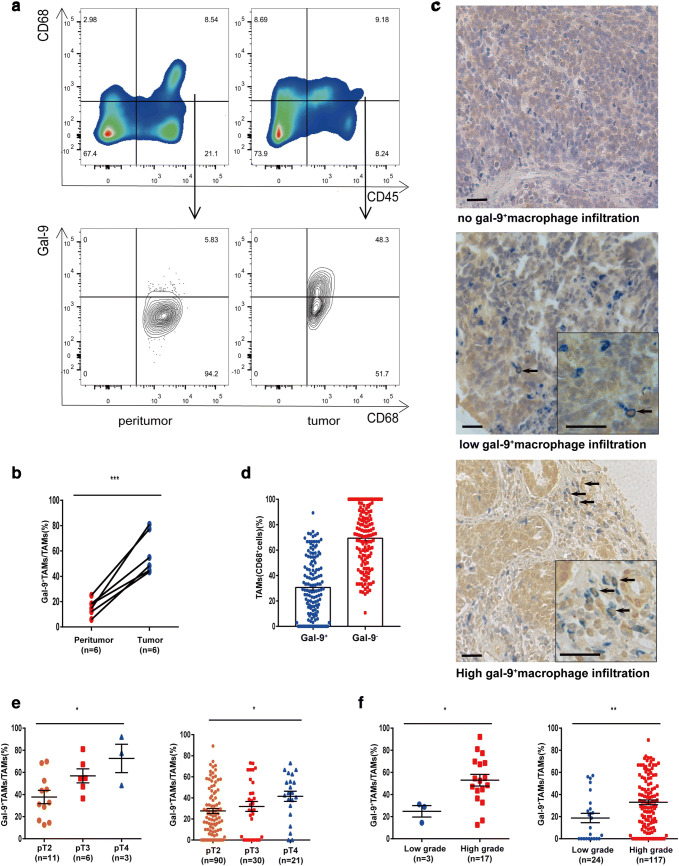
Fig. 1.
Flow cytometric analysis and immunohistochemistry staining confirm the presence of galectin-9+TAMs in MIBC patients. a Representative flow cytometric plots of galectin-9+CD45+CD68+ macrophages. b Percentage of Gal-9+TAMs in tumor and peritumor tissues (n = 6), as based on the paired t test. c Representative images of double staining for galectin-9 (brown) and macrophages (CD68, blue); 200 × magnification; scale bar, 100 μm; 400 × magnification; scale bar, 50 μm. d Proportion of Gal-9+ and Gal-9−TAMs. e Frequency of Gal-9+TAMs among different tumor stages and f grades observed by FCM (left) and IHC (right)

