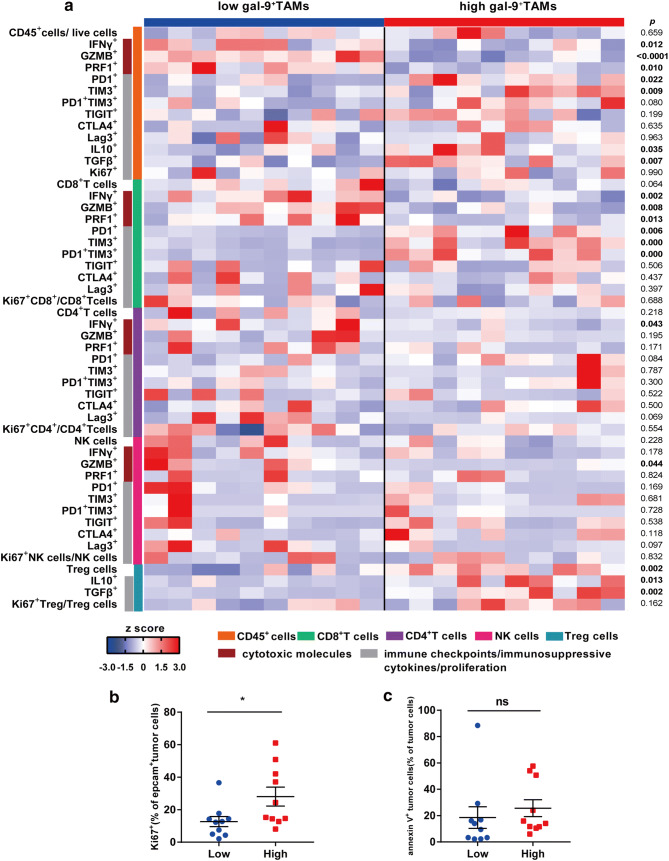
Fig. 5.
High-Gal-9+TAMs are correlated with reduced cytotoxic molecules, enhanced immune checkpoint expression or secretion of immunosuppressive cytokines and active proliferation of tumor cells. a Flow cytometry-generated heat map of cytotoxic markers (IFN-r, GZMB, PRF1), immune checkpoint molecules (PD-1, TIM-3, CTLA-4, TIGIT, Lag-3) and immunosuppressive cytokines (IL-10, TGF-β) of CD45+, CD8+T, CD4+T, NK and Treg cells from MIBC samples with high (n = 10) and low (n = 10) Gal-9+TAM levels. All populations are a fraction of the total CD45+ immune cells, unless otherwise noted. Data for each row are normalized as Z score; each column shows data from one person. b and c Ki67 (left) and annexin V (right) staining of tumor cells between high (n = 10) and low (n = 10) Gal-9+TAM groups

