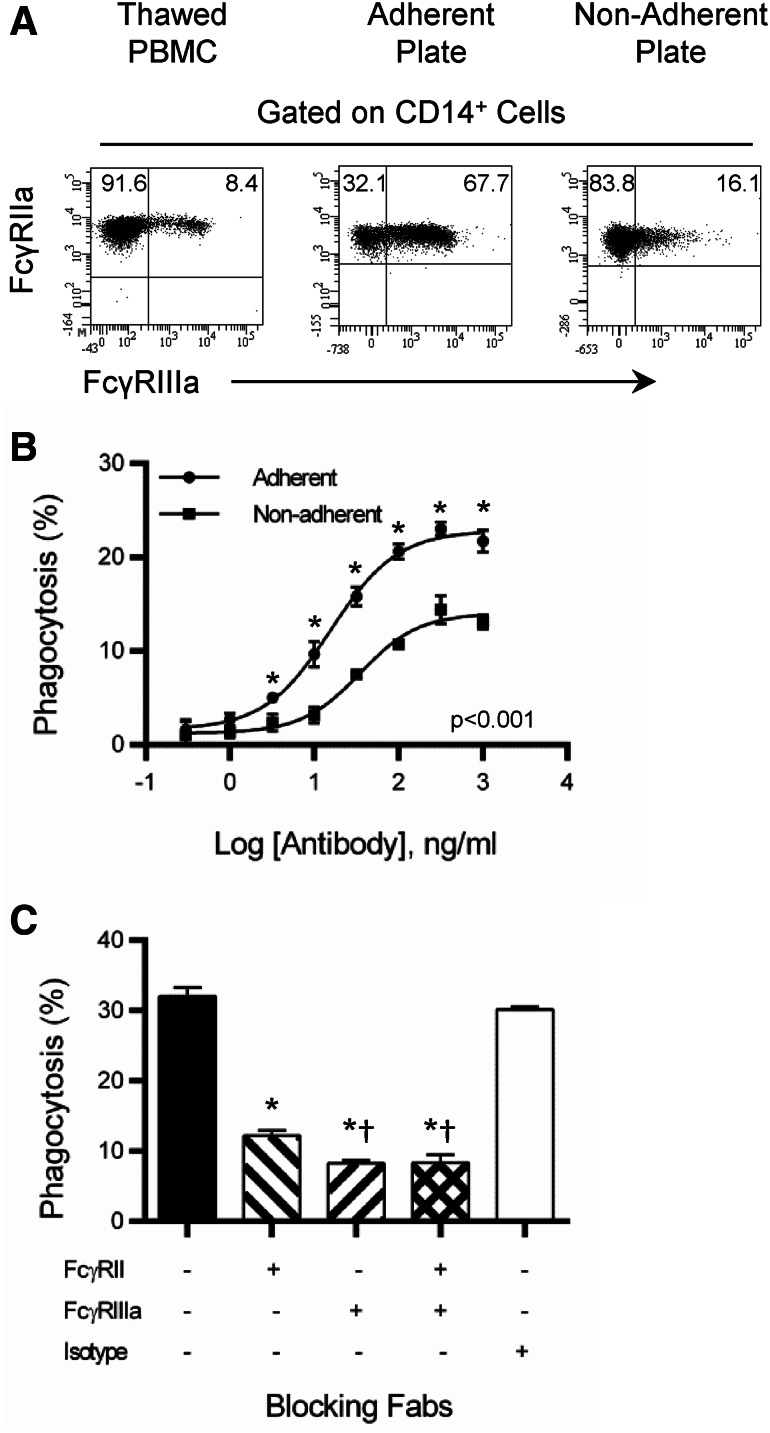
Fig. 5.
FcγRIIa and FcγRIIIa involved with phagocytosis of tumors. a Expression of FcγRIIa and FcγRIIIa from thawed PBMC and those cultured overnight on adherent and non-adherent tissue culture flasks. b Phagocytosis was evaluated as described in Fig. 1. Comparison of phagocytosis from PBMC cultured in adherent and non-adherent tissue culture flasks. All samples were performed in triplicate; means ± SEM and regression line are plotted on the graph. Two-way ANOVA with Sidak’s multiple comparisons test was used to determine the significance. Asterisk represents significance between adherent and non-adherent. Results are representative of two independent experiments. c Phagocytosis was evaluated as described in Fig. 1 with a single concentration of trastuzumab (200 ng/ml). FcγRIIa and FcγRIIIa Fab were used at a concentration of 10 µg/ml. All samples were performed in triplicate; means ± SEM are plotted on the graph. One-way ANOVA with Tukey’s multiple comparisons test was used to determine significance. Asterisk represents significance between untreated and isotype controls and blocking antibodies. †Represents significance between blocking of FcγRIIa and FcγRIIIa or FcγRIIa + FcγRIIIa. Results are representative of two independent experiments

