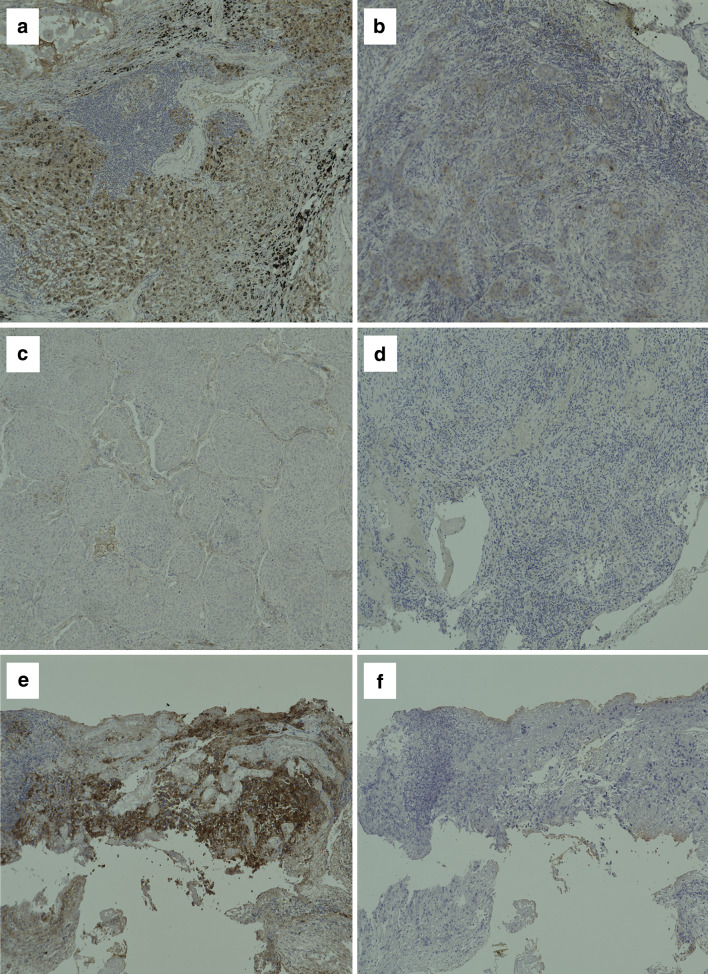
Fig. 1.
Immunohistochemistry of PD-L1 expression and infiltration of ICs in tumor tissues from patients. Representative images of few examples of PD-L1+ non-small cell lung cancer tissue sections, stained for PD-L1 by Immunohistochemistry. The expression of PD-L1 was scored as percentage of observed area, as described in “Patients and methods”. a 3 +, b 2 +, c 1 +, d 0. Infiltration of CD8+ T cells in tumor microenvironment. The infiltration of ICs was scored as a percentage of the observed area. e 3 + and f 0

