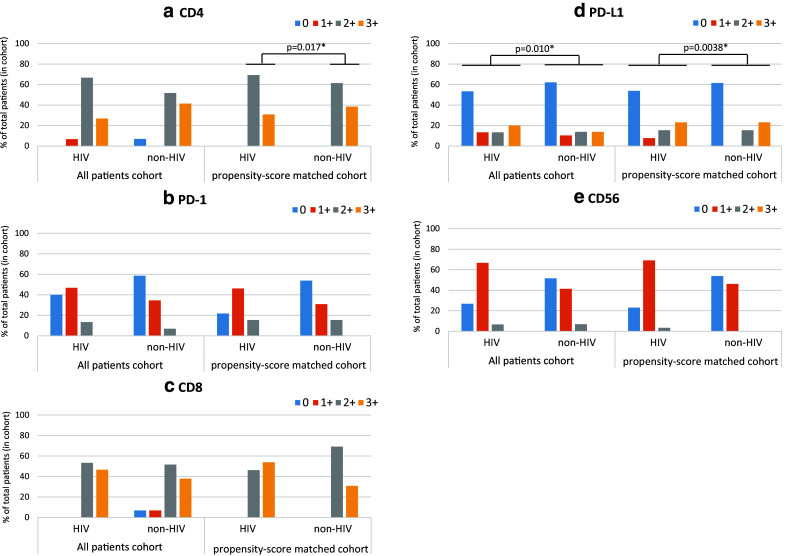
Fig. 2.

Percent of tumor-infiltrating cells (IC) expressing CD4 (a), PD-1 (b), CD8 (c), or CD56 (e), and percent of tumor cells (TC) expressing PD-L1 (d) in all patients and in propensity-score matched patients. Blue bars, red bars, gray bars, and yellow bars indicate the intensity of staining and correspond to: 0 (< 1%), 1 + (≥ 1% and < 5%), 2 + (≥ 5% and < 10%), 3 + (≥ 10%) of the stained population, respectively for figures (a–c, e), and 0 (< 1%), 1 + (≥ 1% and < 5%), 2 + (≥ 5 and < 50%), 3 + (≥ 50%) of the stained population, respectively for figure (d)
