Fig. 3.
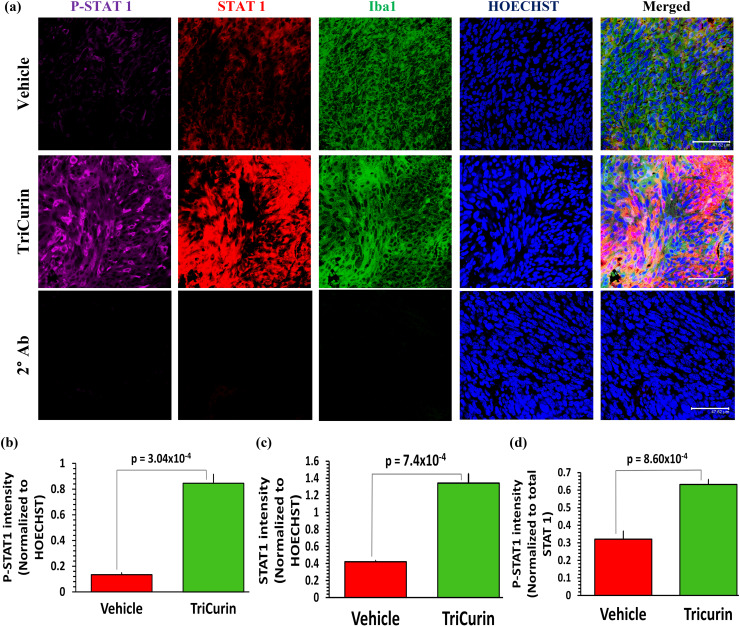
TriCurin treatment causes an induction in P-STAT1 in the TAM. TC-1 tumor sections parallel to those used in Supplementary Fig. 1 were stained to determine the levels of STAT1 and P-Tyr701-STAT1 (activated) in the tumors from Vehicle-treated and TriCurin-treated mice. a Upper and middle rows, and b the Vehicle-treated mice displayed basal levels of activated STAT1 (P-Tyr701-STAT1) in the Iba1+ TAM, which was increased by 532% (p = 3.04 × 10⁻⁴) in the TC-1 tumor sections from the TriCurin-treated group. This overall increase in P-STAT1 was due to a combination of (c) induction of STAT1 expression (STAT1 normalized to HOECHST) and d STAT1 activation (P-STAT1 normalized to STAT1). Four randomly chosen sections per mouse were used for imaging and the data (mean ± SEM) were compared between Vehicle-treated and TriCurin-treated groups (n = 4 per group). (Scale bar: 47.62 µm). (a, lower row) Absence of non-specific staining from the 2° antibodies (see “Materials and methods”)

