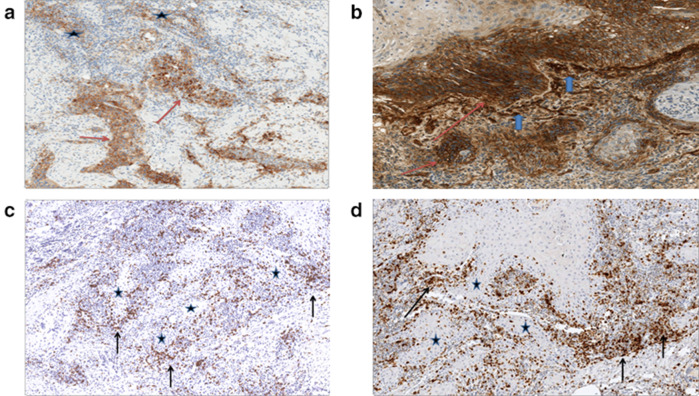
Fig. 1.
Immunostained tumor sections. a PD-L1 expression by the tumor (red arrows) and by tumor-infiltrating immune cells (stars). b B7-H3 expression by the tumor at the advancing tumor edge (red arrows) and in the neovasculature at interface with tumor (blue arrows). c CD8-positive lymphocytes (arrows), Tumor (stars). d PD-1 expressing lymphocytes in the same distribution as CD8-positive lymphocytes (arrows), Tumor (stars)

