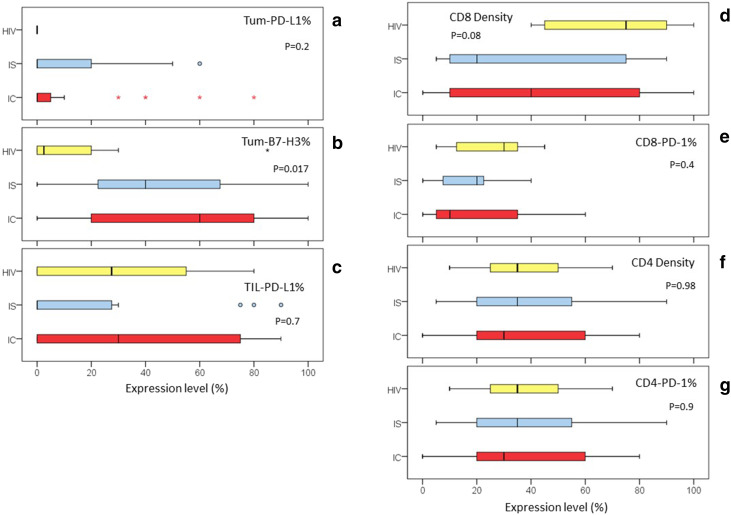
Fig. 2.
Distribution of co-signaling molecule expression and CD8 density by immune status. Box-and-Whiskers plot of the distribution of tumor immunology markers according to immune status: HIV = Yellow, IS = Other Immunosuppressed in Blue, IC = Immunocompetent in Red. a Tum-PD-L1% = percentage of tumor cells expressing PD-L1. b Tum-B7-H3% = percentage of tumor cells expressing B7-H3. cTII-PD-L1% = percentage of tumor-infiltrating immune cells that express PD-L1. d CD8 density = the percentage of peritumoral stroma infiltrated by CD8-positive lymphocytes. e CD8-PD-1% = the percentage of CD8-positive tumor-infiltrating lymphocytes, which expressed PD-1. f CD4 density = the percentage of peritumoral stroma infiltrated by CD4-positive lymphocytes. g CD4-PD-1% = the percentage of CD4-positive tumor-infiltrating lymphocytes, which expressed PD-1

