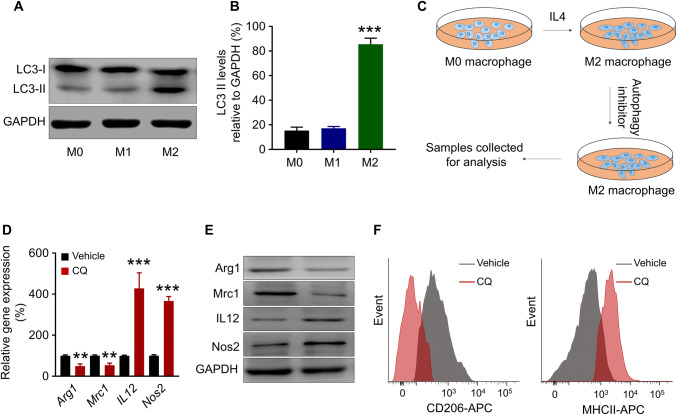
Fig. 2.
Autophagy inhibition repolarises M2 macrophage towards M1 phenotype. a Western blot and b densitometric analysis of LC3-II levels in M1 and M2 macrophages. GAPDH was used as a loading control. ***p < 0.001 (M2 versus M1 macrophage). c Schematic representation of macrophage repolarisation assay. d Transcription level of Arg1, Mrc1, Il12 and Nos2 in M2 macrophages after CQ or vehicle treatment. **p < 0.005, ***p < 0.001 (versus vehicle-treated M2 macrophages). e Western blot of ARG1, MRC1, IL12 and NOS2 in M2 macrophages after CQ or vehicle treatment. f Flow cytometry demonstrating expression of CD206 and MHCII on the M2 macrophage at the 24 h time point following CQ or vehicle treatment

